|

Silver Price Analysis: Break below $29.38 would confirm bearish tendancies

  • Silver has been oscillating in a range since mid May. 
  • More recently it has breached the bottom of the range and looks marginally bearish. 
  • A re-break of the $29.38 level would confirm more downside back inside familiar levels. 

Silver (XAG/USD) has been oscillating between the mid $32s and mid $29s from mid May. More recently, on June 4, Silver decisively broke below multi-year support at the $30.00 mark and fell to a low of $29.38. The break was not sustained, however, as Silver then promptly reversed, broke back up above the level and back into the mid $30s. 

Silver 4-hour Chart 

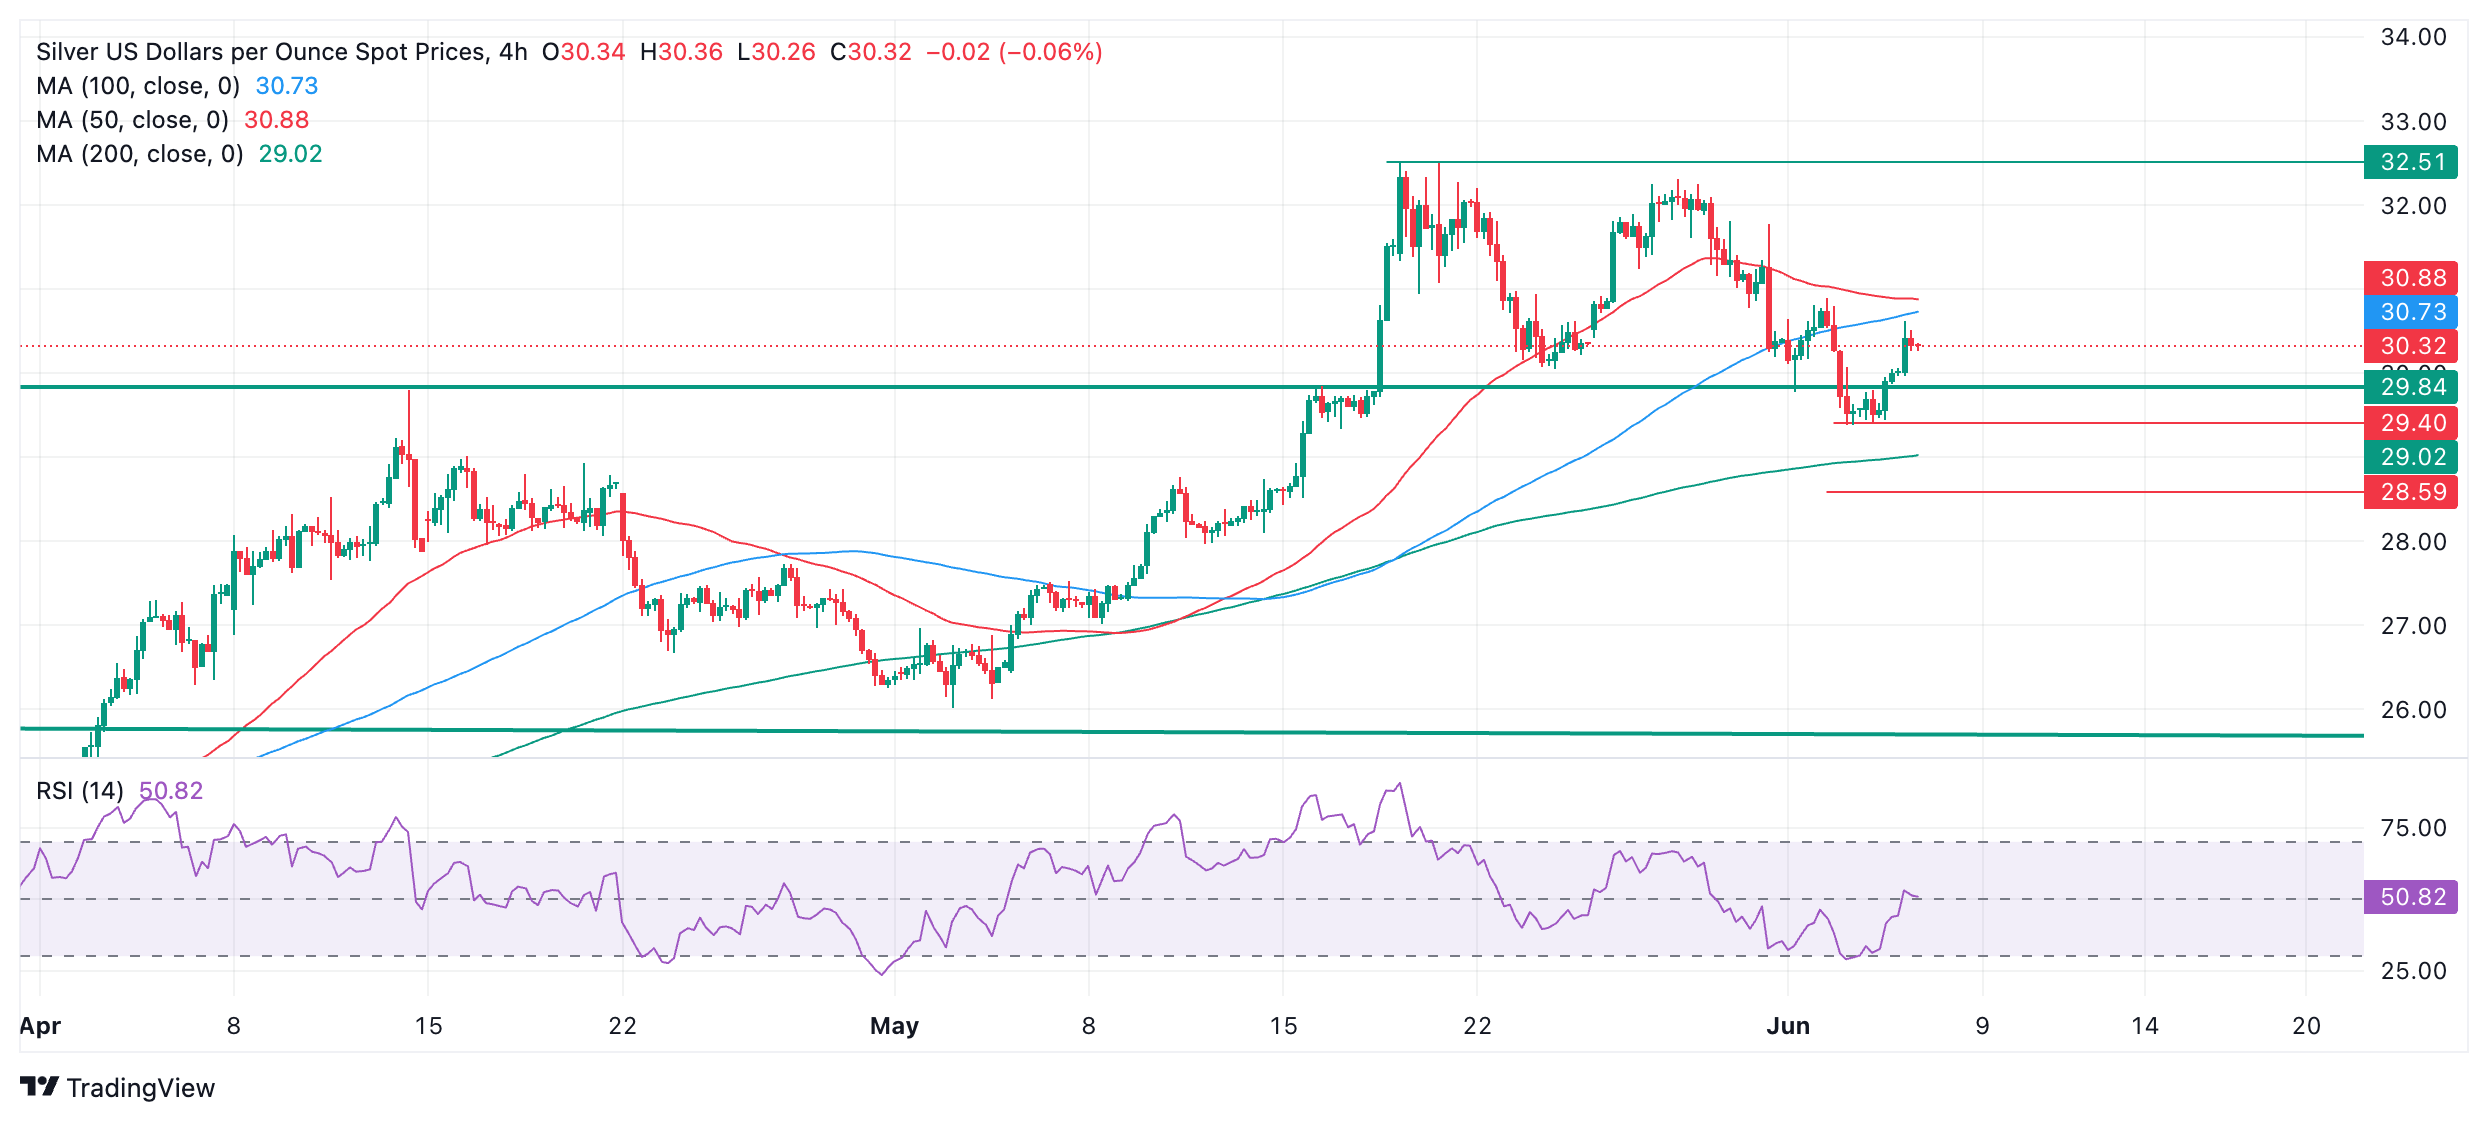
Silver’s tone is marginally bearish. A re-break below the 29.38 June low would provide confirmation of more downside, and probably reverse the trend to bearish in the short-term. 

In such a scenario the next target to the downside might be at around 28.59 (50-day SMA). 

It would require a move back above $32.51 (May 20 high) and the creation of a new high to reinvigorate the uptrend. Such a break might lead Silver to stretch up to the next target at $35.30 (October 2012 high). 

Author

Joaquin Monfort

Joaquin Monfort is a financial writer and analyst with over 10 years experience writing about financial markets and alt data. He holds a degree in Anthropology from London University and a Diploma in Technical analysis.

More from Joaquin Monfort
Share:

Editor's Picks

AUD/USD eyes 0.7150 barrier nine-day EMA

AUD/USD inches higher after registering modest losses in the previous day, trading around 0.7130 during the Asian hours. The technical analysis of the daily chart indicates that the pair is moving sideways within the rectangle pattern, suggesting a consolidation as neither the bulls nor the bears have enough momentum to take control of the market.

USD/JPY trades below 160.00 intervention threshold; bullish bias intact

The USD/JPY pair attracts some sellers during the Asian session amid fears that authorities will step in again to prop up the Japanese Yen. Furthermore, the Israel-Lebanon truce prompts some profit-taking around the US Dollar and exerts downward pressure on the currency pair.

Gold puts its 200-day SMA to the test near $4,420

Gold keeps the bullish stance in place in the latter part of Thursday’s session, although a convincing break above the key $4,500 mark per troy ounce still remains elusive. The precious metal’s advance comes amid the resurgence of some selling interest around the Greenback, improving risk sentiment, and declining US Treasury yields across the board.

Bitcoin’s massive storm is back: Why the sell-off is far from over

Bitcoin price action over the last few weeks has felt less like a normal, healthy correction and more like a slow grinding crash that continues to wreak havoc on holdings and trading accounts. And everything suggests that the dramatic crash isn’t over.

Nonfarm payrolls: Testing the limits of Fed policy patience

The upcoming nonfarm payrolls report for May will provide the final update on the US labor market before Kevin Warsh attends his first policy meeting as the new Fed Chair later this month.

Recession on paper: What really moves the Canadian Loonie now?

Statistics Canada handed the headline writers a gift and the analysts a headache. Real GDP shrank 0.1% on an annualized basis in the first quarter, and with the fourth quarter of 2025 revised down to a 1.0% contraction, that is two negative quarters in a row, the textbook definition of a technical recession and Canada's first since the pandemic.