|

Silver Miners ETF maybe ready to resume higher [Video]

SIL (Silver Miners ETF) is a financial product designed to mirror the performance of silver mining companies. It offers investors a straightforward way to gain exposure to the silver market without directly purchasing physical silver or individual mining stocks. SIL diversifies risk by spreading investments across multiple companies within the sector, potentially providing a hedge against volatility in silver prices. In this article, we will look at the Elliott Wave outlook for the ETF.

SIL (Silver Miners ETF) monthly Elliott Wave chart

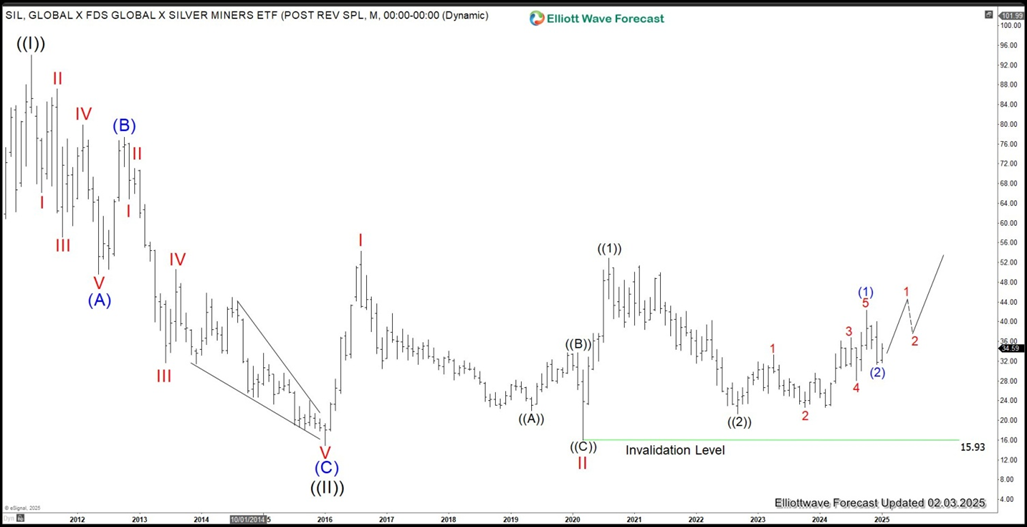
Monthly Elliott Wave chart of SIL above shows the ETF ended Grand Super Cycle wave ((II)) on 2016 at 14.94. From there, the ETF is rallying higher as a nesting impulse. Up from wave ((II)), wave I ended at 54.34 and wave II dips ended at 15.61. The ETF then nested higher within wave III. Up from wave II, wave ((1)) ended at 52.87 and dips in wave ((2)) ended at 21.26.  Then it rallied in wave (1) towards 42.29 and pullback in wave (2) ended at 31.37. As far as pivot at 15.93 low is intact, pullback should find support in 3, 7, 11 swing for further upside.

Silver Miners ETF daily Elliott Wave chart

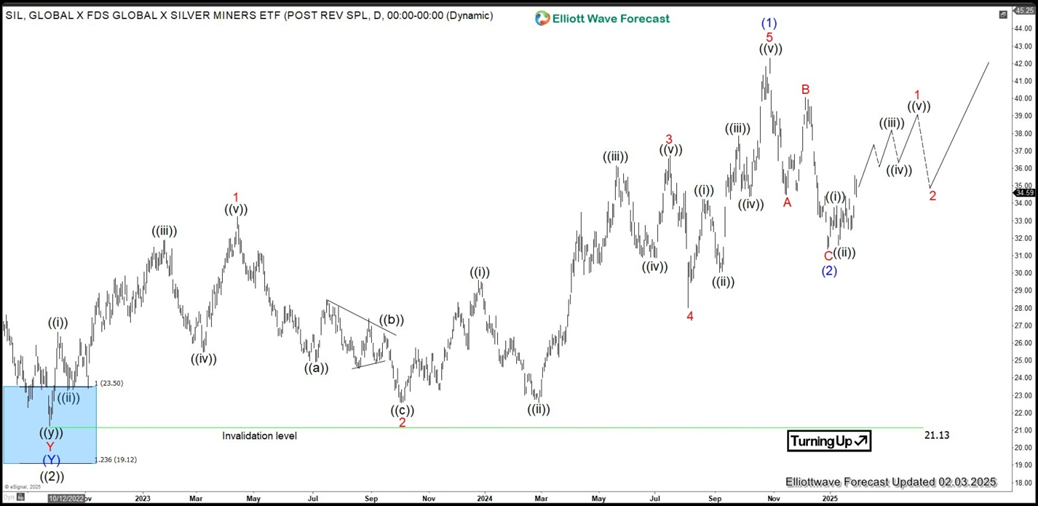
Daily Elliott Wave Chart of Silver Miners ETF (SIL) above shows wave ((2)) pullback ended at 21.13. Rally from wave ((2)) low takes the form of a diagonal 5 waves. Up from wave ((2)), wave 1 ended at 33.24 and wave 2 ended at 22.57. Wave 3 higher ended at 36.75 and wave 4 pullback ended at 28.02. Final leg wave 5 ended at 42.29 which completed wave (1) in higher degree. Near term, while pivot at 21.16 low is holding, expect dips to find buyers in 3, 7, or 11 swing for further upside.

Author

Elliott Wave Forecast Team

Elliott Wave Forecast Team

ElliottWave-Forecast.com

More from Elliott Wave Forecast Team
Share:

Editor's Picks

AUD/USD falls to near 0.7100 after slipping below 50-day EMA

AUD/USD depreciates after registering minor gains in the previous day, trading around 0.7120 during the Asian hours. The technical analysis of the daily chart shows the pair consolidating sideways within a rectangle pattern, as neither bulls nor bears gain control. The AUD/USD pair is holding a slight bearish tone however as it sits beneath both the nine-day and 50-day EMAs.

160.00: USD/JPY back near intervention territory after upbeat US jobs report

US Nonfarm Payrolls beat expectations by a wide margin in May, with 172K jobs added. The US Dollar rebounds after the release, helping USD/JPY recover from its intraday lows. Warnings from Japanese authorities continue to limit upside potential near the 160.00 threshold.

Gold targets $4,300 amid stronger Dollar

Gold faces increasing selling interest and navigates the area of three-month lows near the $4,300 mark per troy ounce on Friday. The precious metal’s decline comes as traders assess the stronger-than-expected NFP, while the bid bias in the Greenback and higher US Treasury yields also collaborate with the retracement.

Cardano hits five-year low even as Hoskinson clarifies "break" isn't an exit

Cardano (ADA) price is down 10% at press time on Friday, extending losses over 30% so far this week amid Charles Hoskinson's clarification that "break" isn't an exit.

Week ahead – Fed countdown begins amid US inflation data and geopolitical risks

Fed Chair Warsh’s first meeting approaches as key US inflation data could reshape expectations. Oil prices remain elevated as US-Iran talks continue; tariffs also return to the spotlight. ECB is expected to hike; will it be a one-off move or is July live?

The US economy defies the rules: 100 days into the Oil shock and the recession signal is still missing

More than three months after the start of the Iran war and the resulting disruption to global energy markets, the US economy continues to display remarkable resilience. The conflict has triggered a sharp rise in Oil prices, reignited inflationary pressures and fueled widespread concerns about a potential economic slowdown.