|premium|

Semiconductors (SMH Stock) long term cycles and Elliott Wave

Firstly as seen on the monthly chart shown below. There is data back to May 2000 in the ETF fund. Data suggests the fund made a low in November 2008. This low has not been taken out in price. The cycles in this instrument tends to reflect the Nasdaq index fairly well. However it has a larger degree difference in that the Nasdaq made a low to correct the cycle from the all time lows in October 2002 compared to the  low made in November 2008 in the SMH semiconductors.

Secondly every way I count this data it suggests several things. Several counts are always possible however the wave (III) in red & blue are still in progress as per the best reading of the cycles.

The analysis continues below the monthly chart.

Chart

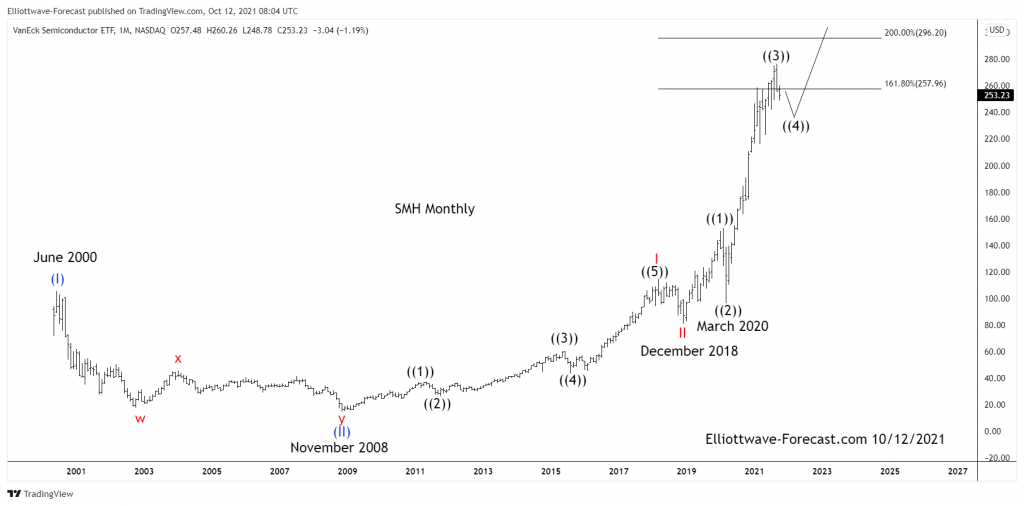
Thirdly it appears a wave ((3)) can have already ended and the instrument can relatively soon end an Elliott Wave ((4)) pullback to correct the cycle from the March 2020 lows. The wave ((4)) should see only around a .236 to .382 retracement of the wave ((3)) before turning higher again in wave ((5)) of III.

In conclusion. It appears the pullback in wave ((2)) to the March 2020 lows corrected the cycle up from the red wave II lows from December 2018. I always like to give the trend benefit of the doubt. In this case it should be obvious the trend is higher. The longer term lows highlighted on the chart suggest the SMH should trade higher. This while pullbacks are shallow and show they will remain above the March 2020 lows. Furthermore importantly while it’s above the December 2018 lows according to the price data currently available.

Premium

You have reached your limit of 3 free articles for this month.

Start your subscription and get access to all our original articles.

Subscribe to PremiumSign In

Author

Elliott Wave Forecast Team

Elliott Wave Forecast Team

ElliottWave-Forecast.com

More from Elliott Wave Forecast Team
Share:

Editor's Picks

EUR/USD recovers further from one-month low set on Friday, eyes mid-1.1800s on weaker USD

The EUR/USD pair is seen building on Friday's late recovery from the 1.1750-1.1740 region, or a nearly one-month trough, and gaining some follow-through positive traction at the start of a new week. The momentum lifts spot prices to the 1.1835 area during the Asian session and is sponsored by a broadly weaker US Dollar.

GBP/USD gathers strength above 1.3500 amid tariff confusion

The GBP/USD pair gains traction to around 1.3520 during the early Asian session on Monday. The US Dollar faces some selling pressure against the Cable as tariff uncertainty lingers. Traders will take more cues from the US Producer Price Index report for January, which will be published later on Friday. 

Gold rallies above $5,150 as Trump’s tariffs boost haven demand

Gold price extends the rally above $5,150 in the Asian session on Monday. The precious metal extends the rally amid US President Donald Trump’s tariff threats and uncertainty, which boost safe-haven flows. US-Iran geopolitical risks also linger, supporting the Gold price upside. 

Week ahead: Markets brace for heightened volatility as event risk dominates

Dollar strength dominates markets as risk appetite remains subdued. A Supreme Court ruling, geopolitics and Fed developments are in focus. Pivotal Nvidia earnings on Wednesday as investors question tech sector weakness. Yen and aussie diverge; both pound and euro could recoup their losses.

Liberation day take two, the tariff machine just changed gears

Let me caveat this from the outset. What we are watching is first-order mechanics, not the grand macro endgame. This is the market’s immediate reflex to a 15% Trump tariff levy dressed up as judicial drama. The Supreme Court blocked Trump tarrif hammer. The White House came back with a scalpel.

Ripple bulls defend key support amid waning retail demand and ETF inflows

XRP ticks up above $1.40 support, but waning retail demand suggests caution. XRP attracts $4 million in spot ETF inflows on Thursday, signaling renewed institutional investor interest.