Santos Limited Elliott Wave technical analysis [Video]
![Santos Limited Elliott Wave technical analysis [Video]](https://editorial.fxstreet.com/images/Markets/Equities/Industries/Materials/extracting_mine_materials2_XtraLarge.jpg)
ASX: STO Elliott Wave technical analysis
Greetings, Our Elliott Wave analysis today updates the Australian Stock Exchange (ASX) with SANTOS LIMITED - STO. We see ASX:STO continuing to push lower, before actually moving higher with the ((3))-navy wave.
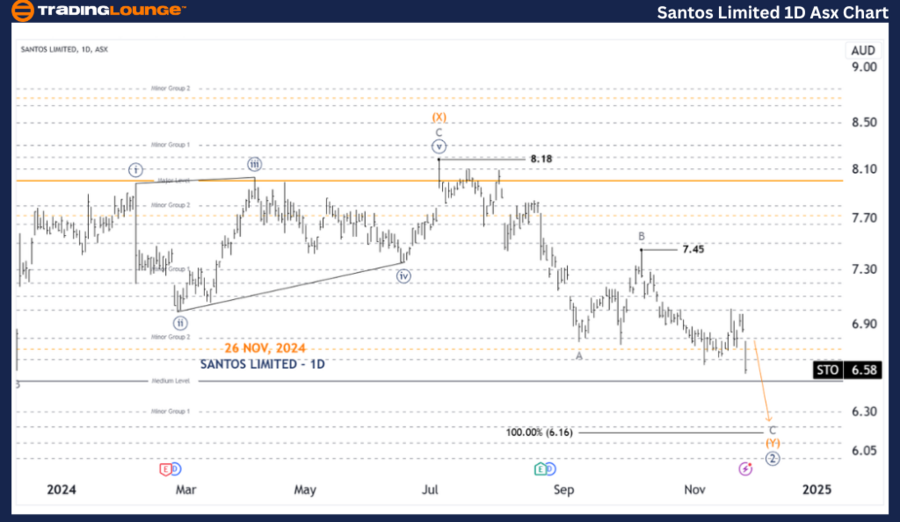
ASX: STO one-day chart (semilog scale) analysis
Function: Major trend (Minor degree, gray).
Mode: Motive.
Structure: Impulse.
Position: Wave C-grey of Wave (Y)-orange of Wave ((2))-navy.
Details: Wave ((2))-navy is still longer than expected, and there is still one more push lower. Then wave ((3))-navy can come back to push higher. It will target around 6.16 (Wave C-grey = Wave A-grey).
Invalidation point: 7.45.
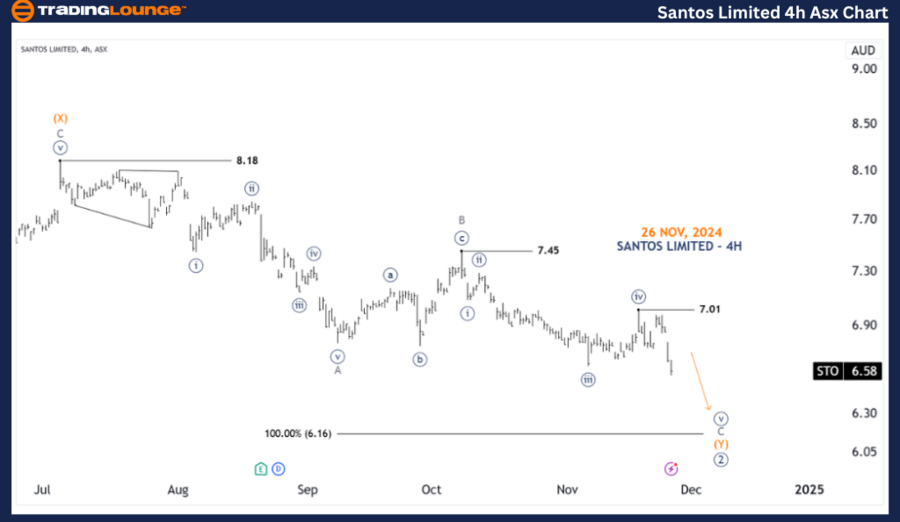
ASX: STO four-hour chart analysis
Function: Counter trend (Primary degree, navy).
Mode: Corrective.
Structure: Double Zigzag.
Position: Wave (v)-navy of Wave C-grey of Wave (Y)-orange of Wave ((2))-navy.
Details: Since the 7.45 high, the grey wave C is unfolding to push lower as a five-wave labeled from wave ((i))-navy to wave ((v))-navy. It will probably continue to push lower, targeting the 6.16 low. While price must remain below 7.01 to maintain this view. Pushing above that level is the first step to show that wave ((3))-navy is probably unfolding.
Invalidation point: 7.01.
Conclusion
Our analysis, forecast of contextual trends, and short-term outlook for ASX: SANTOS LIMITED - STO aim to provide readers with insights into the current market trends and how to capitalize on them effectively. We offer specific price points that act as validation or invalidation signals for our wave count, enhancing the confidence in our perspective. By combining these factors, we strive to offer readers the most objective and professional perspective on market trends.
Santos Limited Elliott Wave technical analysis [Video]
Author

Peter Mathers
TradingLounge
Peter Mathers started actively trading in 1982. He began his career at Hoei and Shoin, a Japanese futures trading company.


