Salesforce Inc. (CRM) Elliott Wave technical analysis [Video]
![Salesforce Inc. (CRM) Elliott Wave technical analysis [Video]](https://editorial.fxstreet.com/images/Markets/Equities/Industries/Transportation/pic-airplane-engine-637435357526453004_XtraLarge.jpg)
CRM Elliott Wave technical analysis
Function: Trend.
Mode: Impulsive.
Structure: Motive.
Position: Minor 3.
Direction: Upside within 3.
Details: Looking for continuation higher into minor wave 3, as we stand above TL3 at 300$.
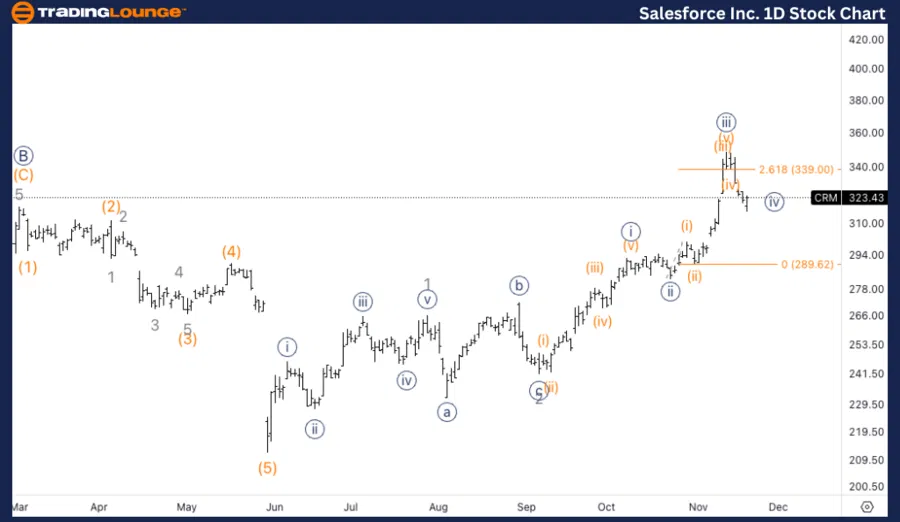
CRM Elliott Wave technical analysis – Daily chart
On the daily chart, Salesforce (CRM) is advancing within Minor wave 3, building momentum as it holds above Trading Level 3 at $300. This suggests bullish continuation, with the possibility of setting new highs in line with the ongoing impulsive structure. The trend remains upward, and the focus is on further gains as wave 3 typically exhibits strong momentum.
CRM Elliott Wave technical analysis
Function: Trend.
Mode: Impulsive.
Structure: Motive.
Position: Wave {iv} of 3.
Direction: Bottom in wave {iv}.
Details: Looking for a bottom in what could be a sharp wave {iv} or else sideways consolidation within the next trading sessions.
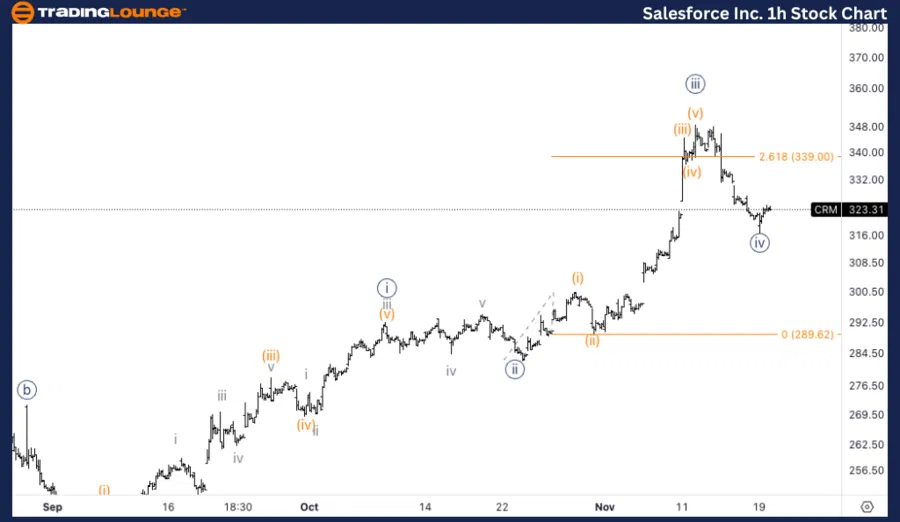
CRM Elliott Wave technical analysis – One-hour chart
On the 1-hour chart, CRM is likely near the end of wave {iv} of Minor wave 3. This wave could take the form of either a sharp correction or sideways consolidation, providing a base for the next leg higher in wave {v}. Traders should watch for signs of a confirmed bottom and renewed upside momentum, particularly as the structure of wave {iv} unfolds in the coming sessions.
This analysis focuses on the current trend structure of Salesforce Inc., (CRM) utilizing the Elliott Wave Theory on both the daily and 1-hour charts. Below is a breakdown of the stock's position and potential future movements.
Salesforce Inc. (CRM) Elliott Wave technical analysis [Video]
Author

Peter Mathers
TradingLounge
Peter Mathers started actively trading in 1982. He began his career at Hoei and Shoin, a Japanese futures trading company.


