S&500 Elliott Wave update: 7,120 here we come

While we have been monitoring the SP500 (SPX) to reach 7120 for some time, in our previous update, we demonstrated that, according to the Elliott Wave Principle (EW), a) the government shutdown would not impact the market; and b) “the 6776 level now acts as a magnet, which is also near the one wave-degree higher (green) 300% Fibonacci extension at 6815. Once reached, the likelihood increases that the market may experience a 3-5% correction again, green W-4, and an ideal target zone of 6150-6375, with the upper end preferred. From there, we anticipate the final rally to reach roughly 7120, …”
The index peaked at 6764 on October 9, dropped to 6555 by October 10, and already reached a new all-time high today. Therefore, although the pullback was shallower and shorter than expected, the index remains on track for 7120. In fact, the government shutdown did not matter. The market marches to its own beat. And as we say, “welcome to a bull market where the downside disappoints and the upside surprises!” Therefore, our overall Elliott Wave-based path is being filled in by the market. See Figure 1 below.
Figure 1. Our preferred short-term Elliott Wave count
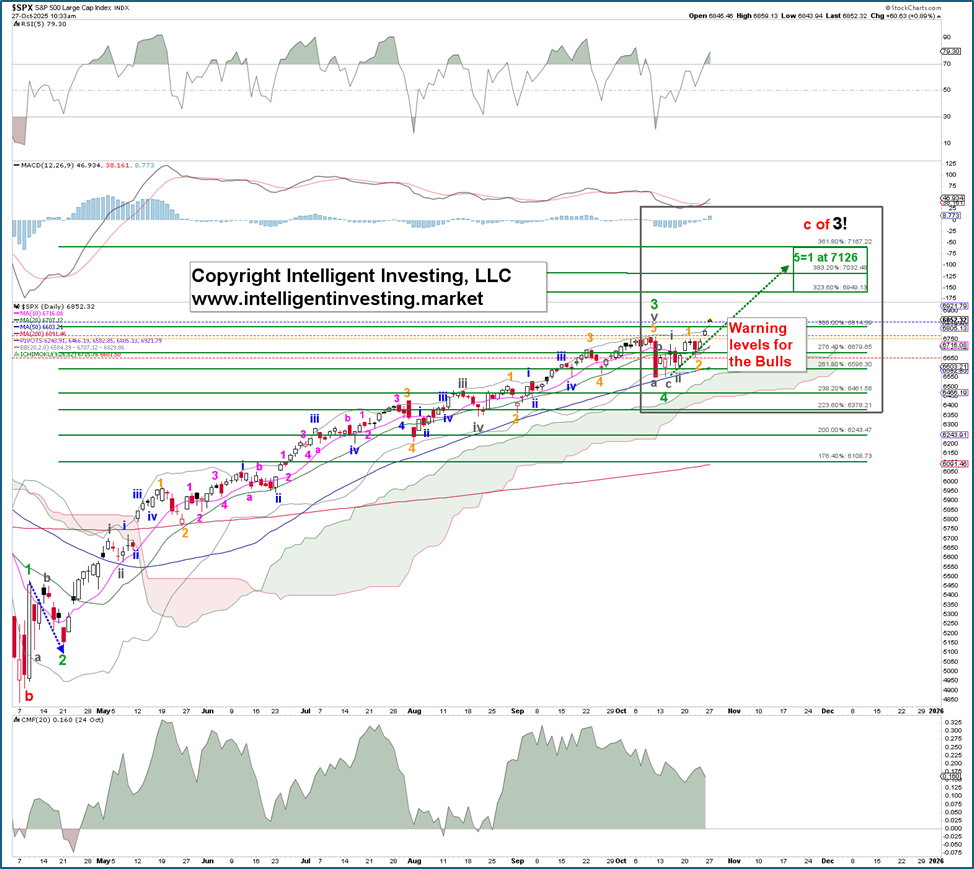
A fifth wave generally matches the length of the first wave. Since (green) W-1 was 570 points, we can estimate a target of 6555 + 571 = 7126 for the green W-5, which is divided into five smaller (gray) waves. The 5=1 target aligns well with our long-standing 7120 target. Once reached, the probability of a 2022-like bear market increases. See Figure 2 below.
Figure 2. Our preferred long-term Elliott Wave count
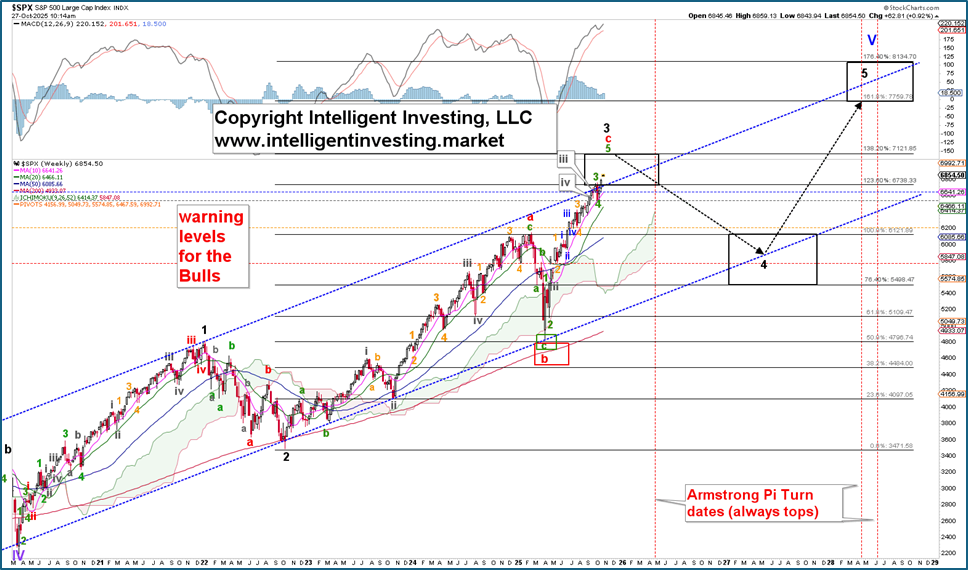
Since we count down weeks as 2nd and 4th waves off the April low, the not-as-deep-as-expected down week ending October 10 can be assessed as the green W-4. The warning levels for this wave count, which have consistently helped our newsletter members stay on the right side of the markets by enabling us to remain long with minimal concerns, have been raised as the SPX moved higher.
For the daily chart, the short-term, i.e. applying to the green W-5, they are now set at: first at 6843 (blue, 25% chance that the green W-5 is over); second at 6772 (gray, 50% chance that the green W-5 is over); third at 6752(orange, 75% chance that the green W-5 is over); and fourth at 6655 (red, green W-5 is definitely over).
For the daily chart, the short-term, i.e. applying to the black W-3, they are now set at: first at 6655 (blue, 25% chance that the W-3 is over); second at 6555 (gray, 50% chance that the W-3 is over); third at 6212 (orange, 75% chance that the W-3 is over); and fourth at 5767 (red, W-3 is definitely over).
Author

Dr. Arnout Ter Schure
Intelligent Investing, LLC
After having worked for over ten years within the field of energy and the environment, Dr.


