|

RY Elliott Wave structure: Looking to buy the next pullback

Royal Bank of Canada., (RY) operates as diversified financial service company worldwide. It operates through personal finance, commercial banking, wealth management & Insurance segments. It comes under Financial services sector & trades as “RY” ticker at NYSE.

As discussed in the last article, RY extends impulse sequence against April-2025 low. Currently, it favors rally in 3 of (1) & expect next pullback to remain supported to see more upside. We like to buy the next correction in 3, 7 or 11 swings in (2) against April-2025 low.

RY – Elliott Wave latest weekly view

Chart

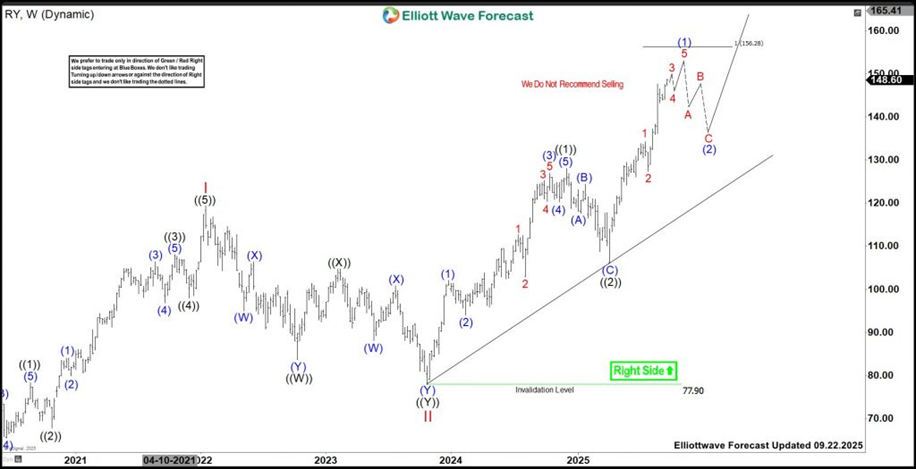
It ended (II) at $49.55 low in March-2020 & favors rally in III of (III). It ended I at $119.41 high in January-2022 & II at $77.90 low in October-2023 low as 0.618 Fibonacci retracement. Within I, it ended ((1)) at $78.31 high, ((2)) at $67.78 low, ((3)) at $108.09 high, ((4)) at $98.00 low & ((5)) at $119.41 high. Within II pullback, it placed ((W)) at $83.63 low, ((X)) at $104.72 high & ((Y)) at $77.90 low as double correction. Above II low, it placed ((1)) at $128.05 high in December-2024 high & ((2)) at $106.10 as zigzag in April-2025. Within ((1)), it ended (1) at $102.07 high, (2) at $93.97 low, (3) at $126.96 high, (4) at $120.26 low & (5) at $128.05 high. Within ((2)) pullback, it placed (A) at $117.63 low, (B) at $124.35 high & (C) at $106.10 low.

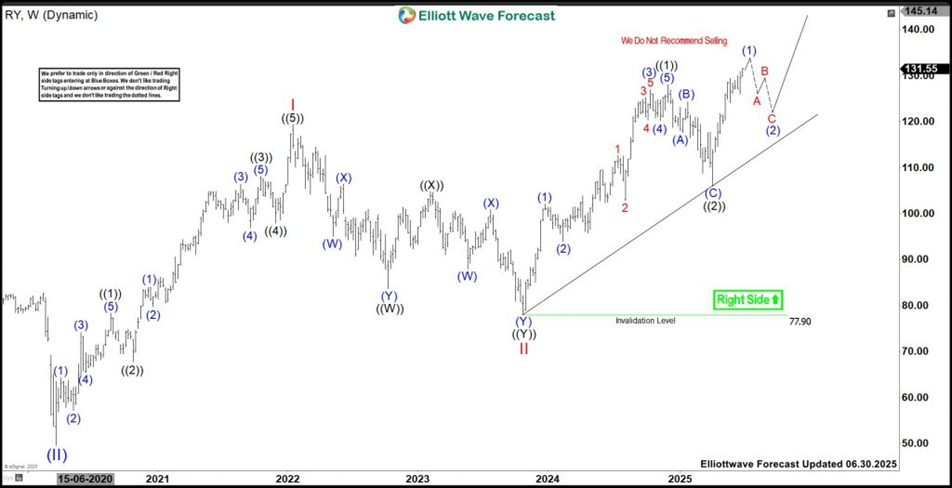
RY – Elliott Wave view from 6.30.2025

Chart

Above ((2)) low, it favors rally in (1) of ((3)) & expect further upside before correcting in (2). Within (1), it ended 1 at $134.26 high, 2 at $127.38 low & favors rally in 3 of (1). It expects further upside 3 before it may start next pullback in 4, followed by final push to finish (1). It managed to erase the momentum divergence in RSI, indicates ((3)) in progress in October-2023 sequence. The current move is the part of ((3)) & expect rally to extend into $156.28 – $187.25 area. We like to buy every pullback in 3, 7 or 11 swings, when reach extreme area above April-2025 low.

Author

Elliott Wave Forecast Team

Elliott Wave Forecast Team

ElliottWave-Forecast.com

More from Elliott Wave Forecast Team
Share:

Editor's Picks

EUR/USD flat lines around 1.1900; looks to US NFP report for fresh directional impetus

The EUR/USD pair is seen oscillating in a narrow trading band around the 1.1900 mark during the Asian session on Wednesday as traders opt to wait for the release of US monthly employment details before placing fresh directional bets.

GBP/USD recovers losses despite rising UK political risks, BoE rate cut bets

Pound Sterling advances against the US Dollar after registering modest losses in the previous session, trading around 1.3650 during the Asian hours on Wednesday. The pair could extend losses as the Pound Sterling faces pressure from rising political risks in the UK and growing expectations of near-term Bank of England rate cuts.

Gold sticks to gains near $5,050 amid Fed-driven USD weakness; focus remains on US NFP

Gold climbs back above the $5,050 level during the Asian session on Wednesday, reversing a part of the previous day's modest losses amid dovish US Federal Reserve-inspired US Dollar weakness. This, in turn, is seen as a key factor acting as a tailwind for the non-yielding yellow metal. 

Bitcoin, Ethereum and Ripple show no sign of recovery

Bitcoin, Ethereum, and Ripple show signs of cautious stabilization on Wednesday after failing to close above their key resistance levels earlier this week. BTC trades below $69,000, while ETH and XRP also encountered rejection near major resistance levels. With no immediate bullish catalyst, the top three cryptocurrencies continue to show no clear signs of a sustained recovery.

Dollar drops and stocks rally: The week of reckoning for US economic data

Following a sizeable move lower in US technology Stocks last week, we have witnessed a meaningful recovery unfold. The USD Index is in a concerning position; the monthly price continues to hold the south channel support.

XRP holds $1.40 amid ETF inflows and stable derivatives market

Ripple trades under pressure, with immediate support at $1.40 holding at the time of writing on Tuesday. A recovery attempt from last week’s sell-off to $1.12 stalled at $1.54 on Friday, leading to limited price action between the current support and the resistance.