|

Russell 2000 (RTY) bearish sequence favors downside [Video]

Russell (RTY) shows a 3 swing from July 31, 2023 high favoring further downside to reach equal legs target. It breaks below August 25 low confirming the idea. The drop from July 31 high is unfolding as a zig zag correction Elliott Wave structure. Down from July 31 high, wave A ended at 1832.80 and wave B corrective rally ended at 1934. Wave C lower is currently in progress as a 5 waves impulse structure. The Index has broken below wave A at 1832.8 confirming the next leg lower has started.

Russell (RTY) 60 minutes Elliott Wave chart

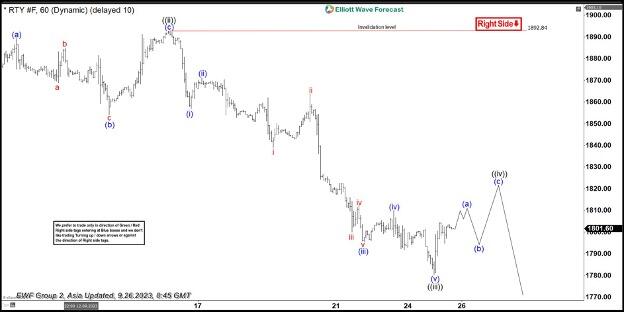
Down from wave B, wave ((i)) completed at 1849.40. A flat wave ((ii)) ended at 1892.70. The 1 hour chart below shows the wave ((ii)) starting point. Index then resumed lower in wave ((iii)) ending at 1780.40. Currently, the market is developing wave ((iv)); therefore, we expect a corrective rally in 3, 7 or 11 swing before it resumes to the downside in wave ((v)) of C. Near term, as far as pivot at 1892.84 high stays intact, expect rally to fail in 3, 7, or 11 swing for further downside. Potential target lower is 100% – 161.8% Fibonacci extension of wave A. This area comes at 1705 – 1749.

Russell (RTY) Elliott Wave video

Author

Elliott Wave Forecast Team

Elliott Wave Forecast Team

ElliottWave-Forecast.com

More from Elliott Wave Forecast Team
Share:

Markets move fast. We move first.

Orange Juice Newsletter brings you expert driven insights - not headlines. Every day on your inbox.

By subscribing you agree to our Terms and conditions.

Editor's Picks

EUR/USD bounces toward 1.1750 as US Dollar loses strength

EUR/USD returned to the 1.1750 price zone in the American session on Friday, despite falling Wall Street, which indicates risk aversion. Trading conditions remain thin following the New Year holiday and ahead of the weekend, with the focus shifting to US employment and European data scheduled for next week.

GBP/USD nears 1.3500, holds within familiar levels

After testing 1.3400 on the last day of 2025, GBP/USD managed to stage a rebound. Nevertheless, the pair finds it difficult to gather momentum and trades with modest intraday gains at around 1.3490 as market participants remain in holiday mood.

Gold trims intraday gains, approaches $4,300

Gold retreated sharply from the $4,400  area and trades flat for the day in the $4,320 price zone. Choppy trading conditions exacerbated the intraday decline, although XAU/USD bearish case is out of the picture, considering growing expectations for a dovish Fed and persistent geopolitical tensions.

Cardano gains early New Year momentum, bulls target falling wedge breakout

Cardano kicks off the New Year on a positive note and is extending gains, trading above $0.36 at the time of writing on Friday. Improving on-chain and derivatives data point to growing bullish interest, while the technical outlook keeps an upside breakout in focus.

Economic outlook 2026-2027 in advanced countries: Solidity test

After a year marked by global economic resilience and ending on a note of optimism, 2026 looks promising and could be a year of solid economic performance. In our baseline scenario, we expect most of the supportive factors at work in 2025 to continue to play a role in 2026.

Crypto market outlook for 2026

Year 2025 was volatile, as crypto often is.  Among positive catalysts were favourable regulatory changes in the U.S., rise of Digital Asset Treasuries (DAT), adoption of AI and tokenization of Real-World-Assets (RWA).