|

Riot Platforms, Inc. (RIOT) Elliott Wave technical analysis [Video]

Riot Platforms, Inc. (RIOT) – Elliott Wave analysis

Daily chart analysis – Technical overview

Function: Trend.

Mode: Motive.

Structure: Impulsive.

Position: Wave {v} of 3.

Direction: Bullish.

Details: Wave {v} of 3 likely targets the 161.8% Fibonacci level of Wave 1.

Chart

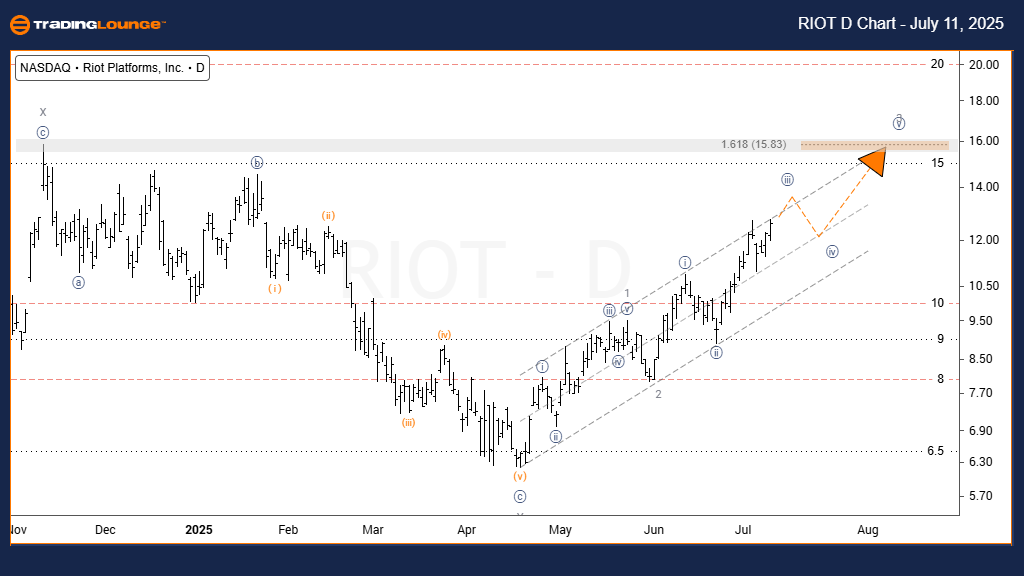
On the daily chart, Riot Platforms, Inc. (RIOT) maintains a strong upward trajectory, advancing within Wave {v} of 3. A breakout above the resistance trendline is expected, potentially signaling the continuation of an impulsive move. As Wave {v} of 3 is often the extended leg in Elliott Wave theory, a projected target near the 161.8% Fibonacci extension of Wave 1 is a reasonable expectation. This setup offers an attractive short-term bullish trading opportunity, aligned with momentum.

Weekly chart analysis – Technical overview

Function: Trend.

Mode: Motive.

Structure: Impulsive.

Position: Wave C of (B).

Direction: Bullish.

Details: Following a channel breakout, prices may rally sharply to complete Wave C of (B).

Chart

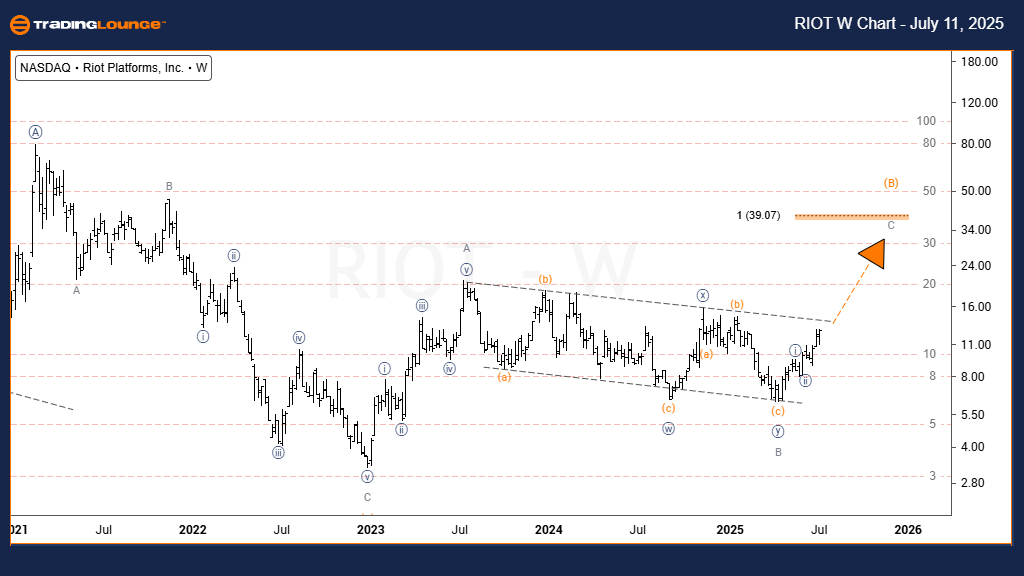
On the weekly timeframe, RIOT is progressing through an impulsive wave within a larger corrective structure. The current move is identified as Wave C of (B), with a potential target around the 100% Fibonacci projection of Wave (A). This wave often produces a strong upward push, especially after a breakout from a parallel channel. While the bullish structure remains intact, traders should monitor key resistance zones and potential consolidation before the trend resumes.

Riot Platforms, Inc. (RIOT) Elliott Wave technical analysis [Video]

Author

Peter Mathers

Peter Mathers

TradingLounge

Peter Mathers started actively trading in 1982. He began his career at Hoei and Shoin, a Japanese futures trading company.

More from Peter Mathers
Share:

Editor's Picks

EUR/USD flirts with daily highs, retargets 1.1900

EUR/USD regains upside traction, returning to the 1.1880 zone and refocusing its attention to the key 1.1900 barrier. The pair’s slight gains comes against the backdrop of a humble decline in the US Dollar as investors continue to assess the latest US CPI readings and the potential Fed’s rate path.

GBP/USD remains well bid around 1.3650

GBP/USD maintains its upside momentum in place, hovering around daily highs near 1.3650 and setting aside part of the recent three-day drop. Cable’s improved sentiment comes on the back of the Greenback’s  irresolute price action, while recent hawkish comments from the BoE’s Pill also collaborate with the uptick.

Gold clings to gains just above $5,000/oz

Gold is reclaiming part of the ground lost on Wednesday’s marked decline, as bargain-hunters keep piling up and lifting prices past the key $5,000 per troy ounce. The precious metal’s move higher is also underpinned by the slight pullback in the US Dollar and declining US Treasury yields across the curve.

Crypto Today: Bitcoin, Ethereum, XRP in choppy price action, weighed down by falling institutional interest 

Bitcoin's upside remains largely constrained amid weak technicals and declining institutional interest. Ethereum trades sideways above $1,900 support with the upside capped below $2,000 amid ETF outflows.

Week ahead – Data blitz, Fed Minutes and RBNZ decision in the spotlight

US GDP and PCE inflation are main highlights, plus the Fed minutes. UK and Japan have busy calendars too with focus on CPI. Flash PMIs for February will also be doing the rounds. RBNZ meets, is unlikely to follow RBA’s hawkish path.

Ripple Price Forecast: XRP potential bottom could be in sight

Ripple edges up above the intraday low of $1.35 at the time of writing on Friday amid mixed price actions across the crypto market. The remittance token failed to hold support at $1.40 the previous day, reflecting risk-off sentiment amid a decline in retail and institutional sentiment.