|

Rigetti Computing Inc. (RGTI) Elliott Wave analysis [Video]

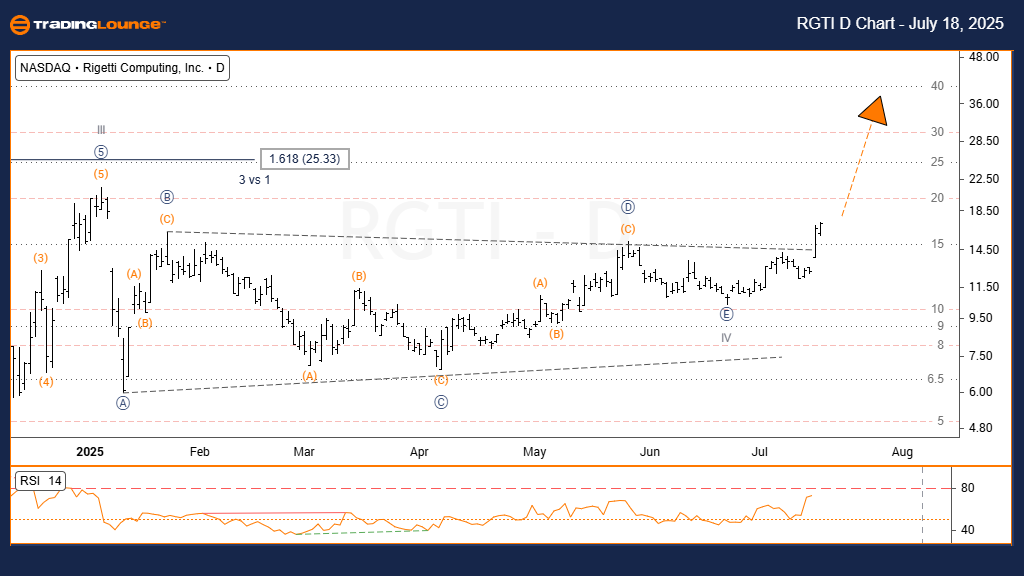
Rigetti Computing Inc. (RGTI) Elliott Wave analysis – Daily chart

  • Function: Trend.

  • Mode: Motive.

  • Structure: Impulsive.

  • Position: Wave V.

  • Direction: Uptrend.

Analysis

On the daily chart, Rigetti Computing Inc. (RGTI) has broken out from a running triangle pattern, indicating the initiation of Wave V. This move follows a consolidation phase that completed Wave IV. The breakout is accompanied by a rise in momentum and volume—key indicators that support a sustained bullish continuation.

Price is now expected to trend higher, with resistance levels projected between $35 and $45, aligning with the expected move post-triangle breakout. Traders should monitor for follow-through buying to confirm the bullish structure remains intact.

Chart

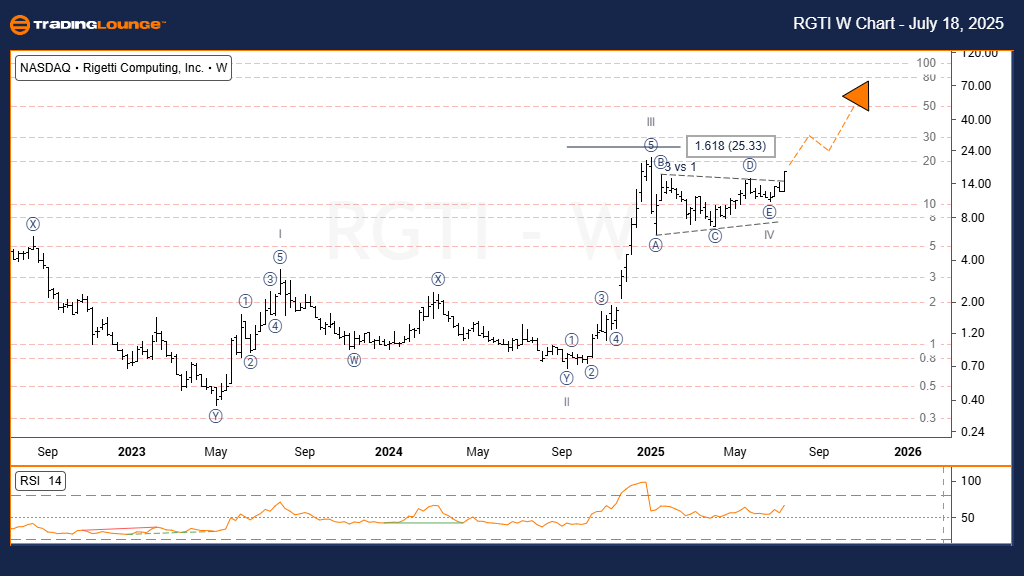
Rigetti Computing Inc. (RGTI) Elliott Wave technical analysis – Weekly chart

  • Function: Trend.

  • Mode: Motive.

  • Structure: Impulsive.

  • Position: Wave V.

  • Direction: Uptrend.

Analysis

The weekly chart reinforces the bullish view, showing that Wave IV completed as a contracting triangle, in line with Elliott Wave alternation principles (as Wave II was a sharp move). The early July breakout above the triangle boundary marks the beginning of Wave V, which is now in progress.

Targets

  • Initial resistance around $40
  • Potential extension to $65, based on a 1.618 Fibonacci projection of Wave I from the Wave IV low

This structure remains valid as long as the price stays above the Wave IV low.

Chart

Rigetti Computing Inc. (RGTI) Elliott Wave analysis [Video]

Author

Peter Mathers

Peter Mathers

TradingLounge

Peter Mathers started actively trading in 1982. He began his career at Hoei and Shoin, a Japanese futures trading company.

More from Peter Mathers
Share:

Editor's Picks

EUR/USD weakens to near 1.1900 as traders eye US data

EUR/USD eases to near 1.1900 in Tuesday's European trading hours, snapping the two-day winning streak. Markets turn cautious, lifting the haven demand for the US Dollar ahead of the release of key US economic data, including Retail Sales and ADP Employment Change 4-week average.

GBP/USD stays in the red below 1.3700 on renewed USD demand

GBP/USD trades on a weaker note below 1.3700 in the European session on Tuesday. The pair faces challenges due to renewed US Dollar demand, UK political risks and rising expectations of a March Bank of England rate cut. The immediate focus is now on the US Retail Sales data. 

Gold sticks to modest losses above $5,000 ahead of US data

Gold sticks to modest intraday losses through the first half of the European session, though it holds comfortably above the $5,000 psychological mark and the daily swing low. The outcome of Japan's snap election on Sunday removes political uncertainty, which along with signs of easing tensions in the Middle East, remains supportive of the upbeat market mood. This turns out to be a key factor exerting downward pressure on the safe-haven precious metal.

Bitcoin Cash trades lower, risks dead-cat bounce amid bearish signals

Bitcoin Cash trades in the red below $522 at the time of writing on Tuesday, after multiple rejections at key resistance. BCH’s derivatives and on-chain indicators point to growing bearish sentiment and raise the risk of a dead-cat bounce toward lower support levels.

Dollar drops and stocks rally: The week of reckoning for US economic data

Following a sizeable move lower in US technology Stocks last week, we have witnessed a meaningful recovery unfold. The USD Index is in a concerning position; the monthly price continues to hold the south channel support.

Bitcoin Cash trades lower, risks dead-cat bounce amid bearish signals

Bitcoin Cash (BCH) trades in the red below $522 at the time of writing on Tuesday, after multiple rejections at key resistance. BCH’s derivatives and on-chain indicators point to growing bearish sentiment and raise the risk of a dead-cat bounce toward lower support levels.