Reece Limited Elliott Wave technical forecast [Video]
![Reece Limited Elliott Wave technical forecast [Video]](https://editorial.fxstreet.com/images/Markets/Equities/DowJones/financial-planning-with-stock-chart-and-pen-17530871_XtraLarge.jpg)
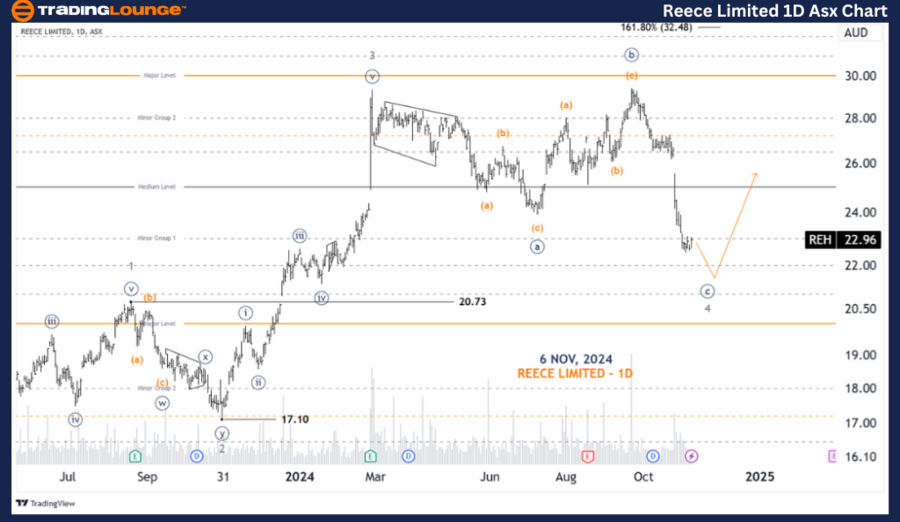
ASX: REH Elliott Wave technical analysis
Greetings, Our Elliott Wave analysis today updates the Australian Stock Exchange (ASX) with REECE LIMITED - REH. We see REH.ASX continuing to push lower with another leg up, and be prepared for a return of the 5-grey wave.
Function: Major trend (Intermediate degree, orange).
Mode: Motive.
Structure: Impulse.
Position: Wave 4-grey.
Details: Wave 4-grey is still extending longer than expected and pushing a little lower. Then wave 5-grey may come back to push higher.
Invalidation point: 20.73.
REH one-day chart
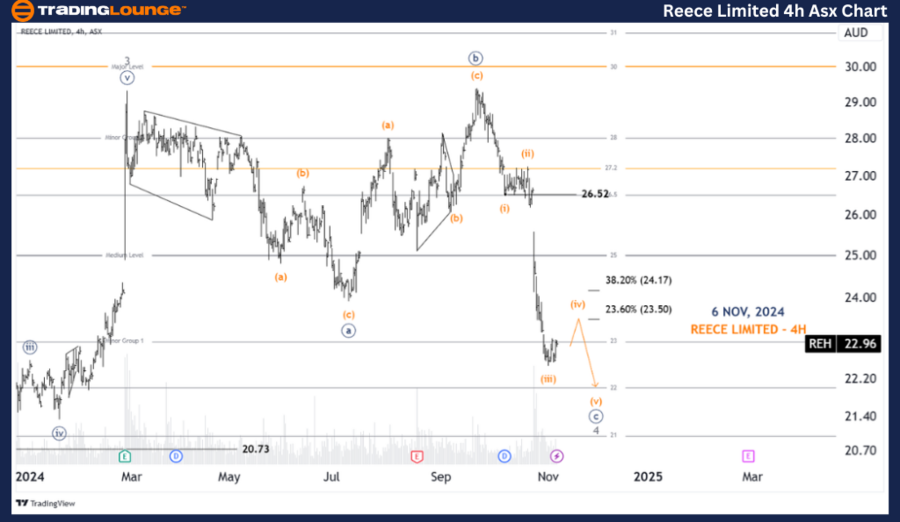
ASX: REH four-hour chart analysis
Function: Major trend (Minute degree, navy)
Mode: Motive
Structure: Impulse
Position: Wave (v)-orange of Wave ((c))-navy of Wave 4-grey
Details: Wave 4-grey is developing as an Expanded Flat, and its wave ((c))-navycontinues to push lower, which itself is subdividing into wave (iv)-orange and it may push a little higher, targeting around 23.50 - 24.17, then wave (iv)-orange will end and wave (v)-orange may return to push lower. And finally after wave 4-grey completes, wave 5-grey will return to push higher.
Invalidation point: 26.52
Conclusion
Our analysis, forecast of contextual trends, and short-term outlook for ASX: REECE LIMITED - REH aim to provide readers with insights into the current market trends and how to capitalize on them effectively. We offer specific price points that act as validation or invalidation signals for our wave count, enhancing the confidence in our perspective. By combining these factors, we strive to offer readers the most objective and professional perspective on market trends.
Reece Limited Elliott Wave technical forecast [Video]
Author

Peter Mathers
TradingLounge
Peter Mathers started actively trading in 1982. He began his career at Hoei and Shoin, a Japanese futures trading company.


