REA Group Ltd Elliott Wave technical forecast [Video]
![REA Group Ltd Elliott Wave technical forecast [Video]](https://editorial.fxstreet.com/images/Markets/Equities/close-up-of-stock-certificate-7978488_XtraLarge.jpg)
REA Elliott Wave technical analysis
Greetings, Our Elliott Wave analysis today updates the Australian Stock Exchange (ASX) with REA GROUP LTD – REA. We see REA.ASX continuing to rise with wave (iii), and then having a pullback with wave (iv), and finally continuing to advance with wave (v).
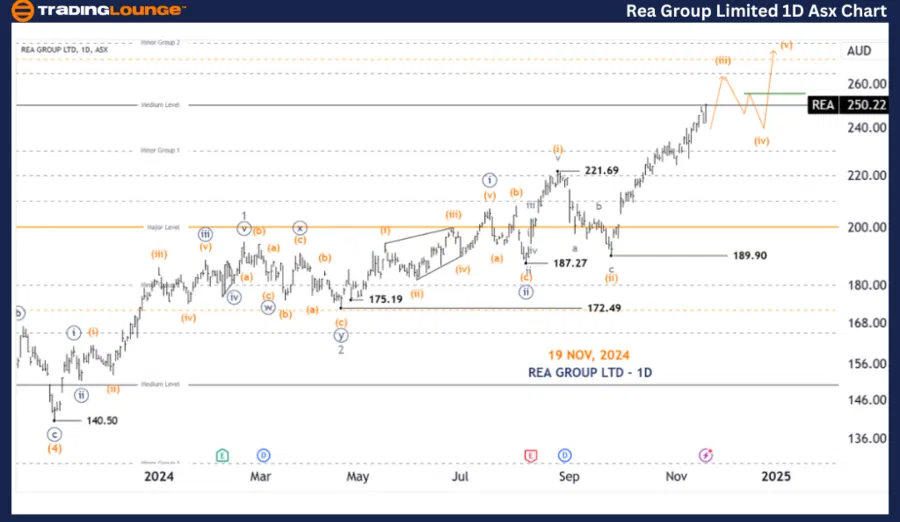
REA one-day chart analysis
Function: Major trend (Minor degree, gray)
Mode: Motive
Structure: Impulse
Position: Wave (iii)-orange of Wave ((iii))-navy
Details: Since 189.90 wave (iii)-orange is pushing higher, and is approaching the Medium Level at 250.00, so basically the upside potential is limited, but basically it can still go up. Then a pullback with wave (iv)-orange will open, and we will have a long trade Setup with it when level 250 becomes tested support towards wave (v)-orange.
Invalidation point: 221.69
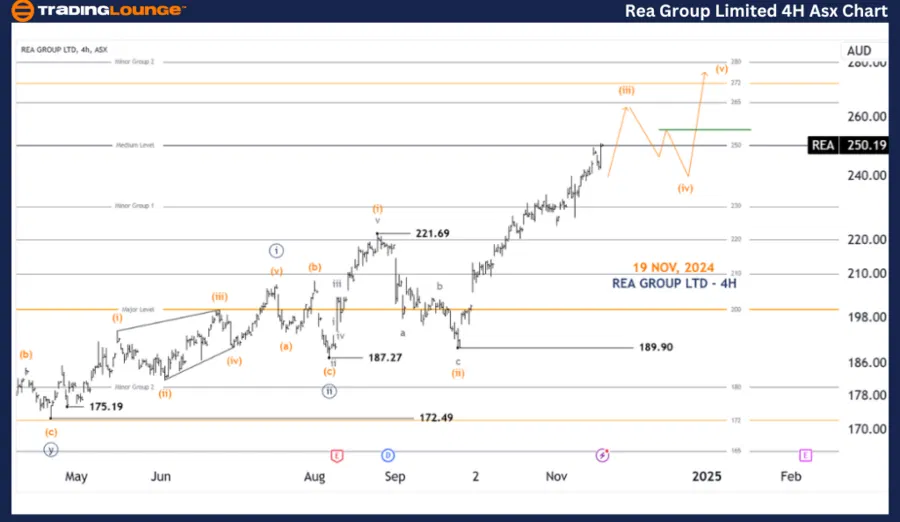
REA four-hour chart analysis
Function: Major trend (Minuette degree, orange)
Mode: Motive
Structure: Impulse
Position: Wave (iii)-orange
Details: Nothing changes when comparing to the 1D chart, the view of pulling back with wave (iv)-orange and then returning with wave (v)-orange will always hold as long as the price stays above 221.69.
Invalidation point: 221.69
Conclusion
Our analysis, forecast of contextual trends, and short-term outlook for ASX: REA GROUP LTD – REA aim to provide readers with insights into the current market trends and how to capitalize on them effectively. We offer specific price points that act as validation or invalidation signals for our wave count, enhancing the confidence in our perspective. By combining these factors, we strive to offer readers the most objective and professional perspective on market trends.
REA Group Ltd Elliott Wave technical forecast [Video]
Author

Peter Mathers
TradingLounge
Peter Mathers started actively trading in 1982. He began his career at Hoei and Shoin, a Japanese futures trading company.


