Procter & Gamble stock leads Dow Jones lower
- Procter & Gamble stock sinks 4.75% on Friday.
- Dow Jones sheds 0.37% despite NASDAQ gains.
- BNP Paribas analyst cites volatility in US consumer staples category.
- US Retail Sales for January hit -0.9%, surpising market.

Procter & Gamble (PG) stock was the worst performer in the Dow Jones Industrial Average (DJIA) on Friday. Normally a less volatile holding, PG shares tumbled after a PNB Paribas analyst questioned 2025 guidance for the maker of well-known, fast-moving consumer brands like Pampers, Gillette and Crest.
The outlook for Procter & Gamble was exacerbated by a poor US Retails Sales print that showed the US economy might be in bad shape. The DJIA slumped nearly 0.4%, but the NASDAQ gained a similar amount as some investors thought the poor economic data might usher in an interest rate cut from the Federal Reserve (Fed) on a closer timeline.
Procter & Gamble stock news
Kevin Grundy, the PNB Paribas analyst, met with Procter & Gamble CEO Jon Moeller Thursday and didn’t like what he was hearing. Moeller admitted that his company is experiencing high volatility in the US consumer staples sector that is "probably higher today" than at any time in the CEO’s tenure.
Moeller claimed to be seeing slowing demand across categories in the US market despite seeing good traction globally and especially in Latin America and Europe. Additionally, he said that de-stocking was an added obstacle.
Grundy’s client note argues that the volatility makes P&G’s 2025 organic sales growth less certain. Moeller claimed that there was enough flexibility to protect earnings per share from any slowing in US organic growth.
Grundy said that Procter & Gamble’s guidance for the year was now probably in doubt until more clarity was achieved via further quarterly results.
The news hit harder as it came during the same session when US Retails Sales for January plummeted, coming in as it did at -0.9% MoM. The market had expected the figure at -0.1%. However, December’s figure was revised upward from 0.4% to 0.7% MoM, so that also exacerbated the monthly print.
US Retails Sales in January fell on account of consumers reducing spending in the autos and auto-related merchandise category, as well as sporting goods, furniture and home furnishings.
PG stock forecast
Procter & Gamble stock, not known for wild swings, fell off a cliff on Friday. PG shares are now treading water well below the 200-day Simple Moving Average (SMA).
The Moving Average Convergence Divergence (MACD) indicator shows a general crossover that makes further downside more likely. The MACD had been trending upward since January, and that rally appears to be over.
Without much nearby support on the daily chart, traders should expect support to appear in the large green-shaded band running from $153.50 to $160.00. That is where PG discovered support beginning in April 2024 and running through most of last year. PG stock will need to form a new range high above $172.00 in order to put the present negativity behind it.
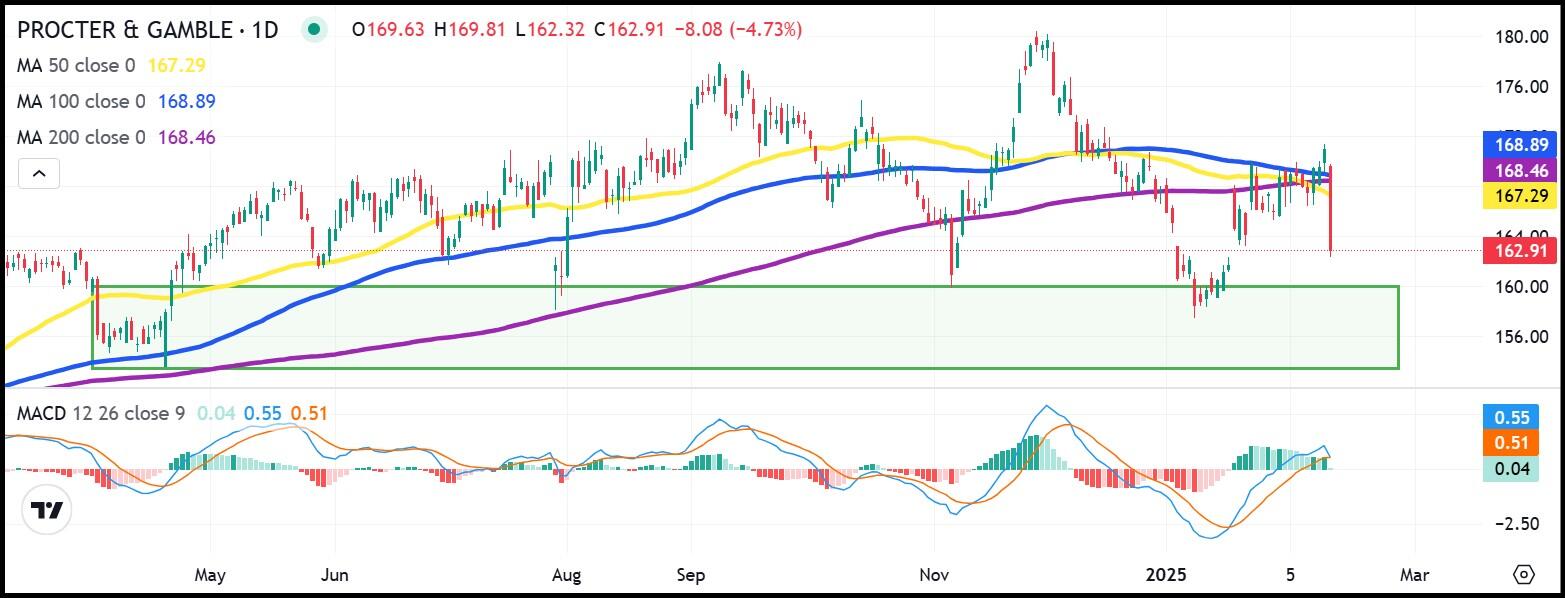
PG daily stock chart
Author

Clay Webster
FXStreet
Clay Webster grew up in the US outside Buffalo, New York and Lancaster, Pennsylvania. He began investing after college following the 2008 financial crisis.