Powering the future: ARM breakout potential in a connected world

ARM Holdings plc is a relatively new entrant to public markets, yet its technological foundation is anything but inexperienced. Renowned for pioneering energy-efficient, high-performance processor designs, ARM powers billions of devices globally. Its recent IPO signals a strategic leap, positioning the company for strong, long-term growth as demand for smart, connected technologies accelerates.
ARM enjoys strong positioning in the AI and mobile computing boom. Its licensing model delivers recurring revenue and scalability across multiple markets. Moreover, the company’s robust ecosystem encourages adoption and long-term customer relationships, securing its role in tech’s future.
ARM’s chart reflects solid upside momentum above key moving averages. Bullish breakouts signal trend strength, supported by healthy trading volume. Additionally, positive momentum indicators suggest continued buying interest, reinforcing current price action.
ARM Daily Chart June 2025
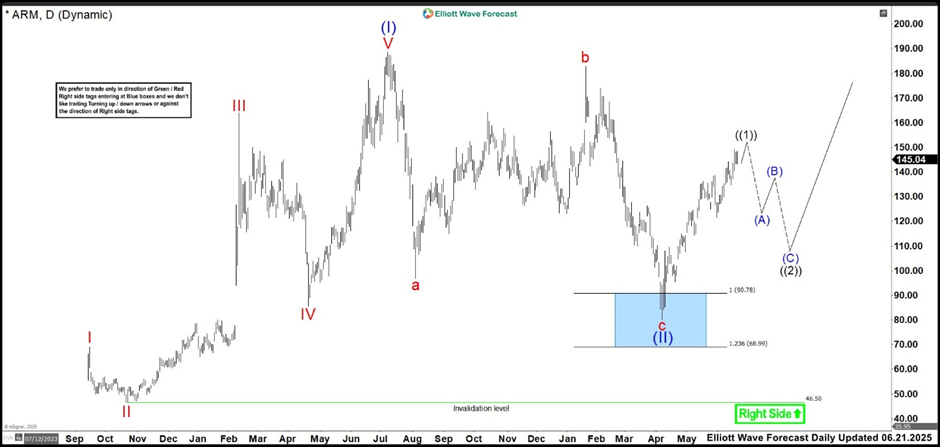
In the daily chart above, ARM Holdings began a strong impulsive rally ending wave (I) at 188.75 high. After that, the stock entered a flat correction as wave (II), retracing into the 90.78–68.99 Blue Box—a high-probability reversal zone. The pullback bottomed at 80.00 low, completing wave (II) and triggering a sharp bullish reaction. That move launched a wave ((1)) impulse, which continues unfolding with momentum. Once wave ((1)) completes, expect a pullback in wave ((2)). Typically, wave ((2)) unfolds in 3, 7, or 11 swings. After that, the broader rally is likely to resume. Traders should monitor the correction for entry opportunities.
ARM Daily Alternative Chart June 2025
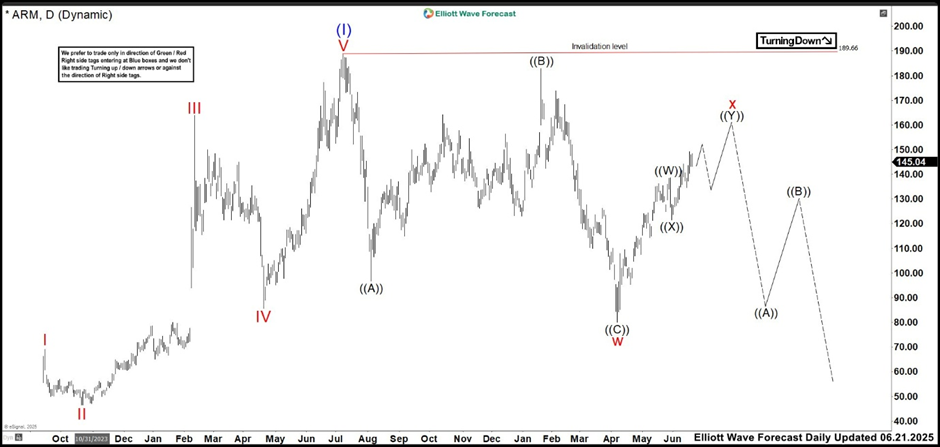
While the current reaction from the Blue Box supports the bullish scenario, an alternate view suggests wave (II) may not be completed. In this case, the decline into the 80.00 low would mark wave w of a double correction. The current bounce would then be part of a wave x connector, setting the stage for another leg lower. If so, wave y could take the stock below 80.00 to complete wave (II) and offer a high probability buying opportunity.
To invalidate this alternate scenario, price must break above the 188.75 high. Until then, both views remain valid, and traders should stay flexible while tracking the structure in real time. Stay tuned as the market unfolds the next wave—trade smart!
Author

Elliott Wave Forecast Team
ElliottWave-Forecast.com


