Pound Sterling Price News and Forecast: GBP/USD in a third week of declines? Delta, data and dollar


GBP/USD outlook: Bulls regain traction but more evidence needed to signal reversal

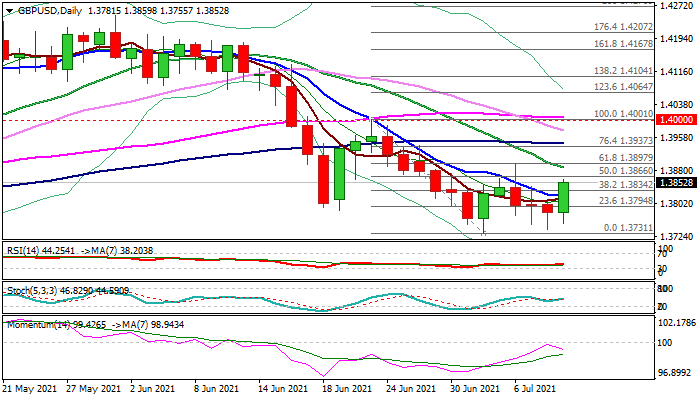
Cable regained traction on Friday after negative tone prevailed during this week, with three-day drop ending with a hammer candle that generated initial bullish signal. Fresh advance nearly fully reversed losses of this week but needs lift above pivotal barriers at 1.3887/97 (falling 20DMA / Fibo 61.8% of 1.4001/1.3731 bear-leg) to confirm reversal signal and open way for stronger recovery. Formation of bullish engulfing today would add to positive tone, but stall of 19-d momentum rally on approach to centreline and subsequent descend, warn that recovery may run out of steam. Read more...

GBP/USD Weekly Forecast: A third week of declines? Delta, data and dollar strength promise action

GBP/USD has failed to take advantage of the upcoming UK reopening. Inflation data on both sides of the pond, UK jobs and US retail sales predict major movement ahead. Mid-July's daily chart shows bears remain in the lead. The FX Poll is pointing to a gradual upward move. King Dollar reigned supreme, almost regardless of bond yields and some Fed caution. Top-tier US consumer data and Britain's jobs report are now eyed – alongside growing fears of the Delta variant on both sides of the pond. Read more...

GBP/USD quickly erodes 50-pips, turns south towards 1.3800

GBP/USD rises for the first time in four trading days. Risk recovery offsets poor UK data, Brexit, covid woes. DXY weakness boosts the cable but London fix weighs. GBP/USD runs into fresh supply into the London fix on Friday, quickly giving away nearly 50-pips to turn back towards the 1.3800 level. Read more...

GBP/USD

Overview
Today last price 1.3853
Today Daily Change 0.0068
Today Daily Change % 0.49
Today daily open 1.3785
 
Trends
Daily SMA20 1.3902
Daily SMA50 1.4019
Daily SMA100 1.3947
Daily SMA200 1.3669
 
Levels
Previous Daily High 1.3806
Previous Daily Low 1.3742
Previous Weekly High 1.394
Previous Weekly Low 1.3732
Previous Monthly High 1.4249
Previous Monthly Low 1.3787
Daily Fibonacci 38.2% 1.3766
Daily Fibonacci 61.8% 1.3782
Daily Pivot Point S1 1.3749
Daily Pivot Point S2 1.3714
Daily Pivot Point S3 1.3685
Daily Pivot Point R1 1.3813
Daily Pivot Point R2 1.3842
Daily Pivot Point R3 1.3877


Share: Feed news

Information on these pages contains forward-looking statements that involve risks and uncertainties. Markets and instruments profiled on this page are for informational purposes only and should not in any way come across as a recommendation to buy or sell in these assets. You should do your own thorough research before making any investment decisions. FXStreet does not in any way guarantee that this information is free from mistakes, errors, or material misstatements. It also does not guarantee that this information is of a timely nature. Investing in Open Markets involves a great deal of risk, including the loss of all or a portion of your investment, as well as emotional distress. All risks, losses and costs associated with investing, including total loss of principal, are your responsibility. The views and opinions expressed in this article are those of the authors and do not necessarily reflect the official policy or position of FXStreet nor its advertisers. The author will not be held responsible for information that is found at the end of links posted on this page.

If not otherwise explicitly mentioned in the body of the article, at the time of writing, the author has no position in any stock mentioned in this article and no business relationship with any company mentioned. The author has not received compensation for writing this article, other than from FXStreet.

FXStreet and the author do not provide personalized recommendations. The author makes no representations as to the accuracy, completeness, or suitability of this information. FXStreet and the author will not be liable for any errors, omissions or any losses, injuries or damages arising from this information and its display or use. Errors and omissions excepted.

The author and FXStreet are not registered investment advisors and nothing in this article is intended to be investment advice.

Recommended content


Recommended content

Editors’ Picks

EUR/USD turns positive above 1.1500, Dollar retreats

EUR/USD turns positive above 1.1500, Dollar retreats

EUR/USD now makes a reversal, up modestly for the day after surpassing the 1.1500 barrier. The pair’s rebound came on the back of increasing and renewed selling pressure around the Greenback, particularly after FOMC Governor M. Bowman opened the door to a July rate cut. Meanwhile, investors remain watchful of the geopolitical landscape ahead of a potential move by Iran in response to the recent US attacks.

Could Iran block the Strait of Hormuz? Why Oil is on edge after US strikes

Could Iran block the Strait of Hormuz? Why Oil is on edge after US strikes

As the Israel-Iran conflict reaches new heights, an old threat is coming back to haunt the markets: that of the closure of the Strait of Hormuz. This narrow arm of the sea in the Persian Gulf, wedged between Iran to the north and the United Arab Emirates and Oman to the south, is much more than a simple sea passage.

Gold treads water below $3,400 on stronger USD

Gold treads water below $3,400 on stronger USD

Gold begins the week on a downward trend, trading below the key $3,400 mark per troy ounce. In the meantime, the precious metal has managed to limit its losses amid the stronger US Dollar (USD) and rising geopolitical tensions in the Middle East.

AI Tokens Price Prediction: Story, Virtuals Protocol rebound following sell-off after US strikes on Iran

AI Tokens Price Prediction: Story, Virtuals Protocol rebound following sell-off after US strikes on Iran

Geopolitical tensions in the Middle East caused a liquidation havoc of over $1 billion in the cryptocurrency market over the weekend, following US President Donald Trump’s direct involvement in the conflict between Israel and Iran.

GBP/USD climbs to daily highs around 1.3480

GBP/USD climbs to daily highs around 1.3480

After bottoming out in multi-week lows near 1.3370, GBP/USD now picks up pace and gains around a cent to hit new daily peaks around 1.3480 in response to fresh selling pressure hitting the Greenback. The knee-jerk in the US Dollar comes despite steady fears on the Iran-Israel-US front and firm results from preliminary US PMIs for the month of June. On the UK docket, all the attention remains on upcoming flash Manufacturing and Services PMIs.

The Best brokers to trade EUR/USD

The Best brokers to trade EUR/USD

SPONSORED Discover the top brokers for trading EUR/USD in 2025. Our list features brokers with competitive spreads, fast execution, and powerful platforms. Whether you're a beginner or an expert, find the right partner to navigate the dynamic Forex market.

Forex MAJORS

Cryptocurrencies

Signatures

Best Brokers of 2025