Pound Sterling Price News and Forecast: GBP/USD gains capped by 200-period MA, bearish risks rekindled

GBP/USD: A move towards the 1.314 is expected
Looking at GBPUSD Chart, we can see it’s been trading in a channel from the 9th of April up until yesterday’s session, bouncing between support of 1.298 and overhead resistance of 1.305. Early on yesterday’s session, we saw it rally from the 1.3 range to the high of 1.314 but unable to consolidate at that level it experienced a retraction, falling back to the 1.305 level where it was last found trading.
Today we can expect a move towards the 1.314 closest overhead resistance due to the spike in positive momentum. Read more...
-637856125135889997-637856160004127749.png)
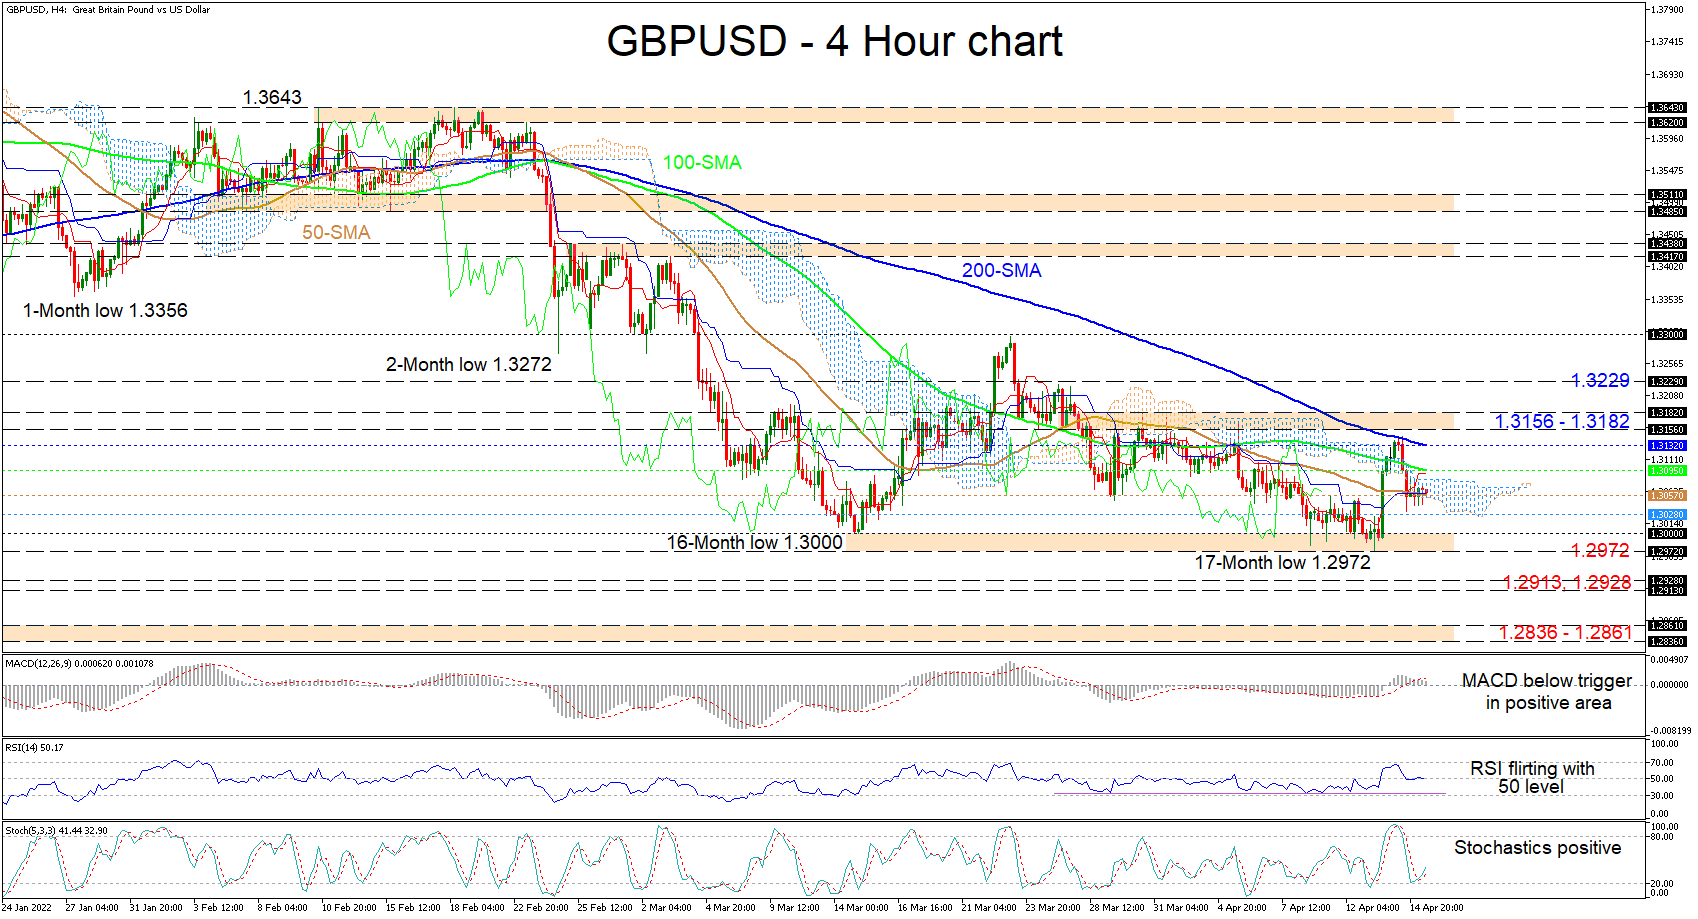
Technical analysis: GBP/USD gains capped by 200-period MA, bearish risks rekindled
GBPUSD’s fresh drop has stabilized around its 50-period simple moving average (SMA), after the scenario of a sturdy rally was dampened by the descending 200-period SMA and the 1.3156-1.3182 barricade overhead. Furthermore, the negative picture in the pair is being nurtured by the downward demeanour of the SMAs.
Currently, the Ichimoku lines are highlighting a state of frail driving forces, while the short-term oscillators are transmitting mixed signals in directional momentum. The MACD, slightly above the zero threshold, is suggesting positive momentum is dwindling, while the stochastic oscillator is promoting bullish impetus. Meanwhile, the RSI is toying with the 50 neutral level, demonstrating no clear winner between buyers and sellers for the moment. Read more...
GBP/USD Price Analysis: A pullback toward the 20-EMA sense an optimal buy
The GBP/USD pair is facing corrective action after a juggernaut rally from Wednesday’s low at 1.2973. The cable has been corrected to a near 20-period Exponential Moving Average (EMA) and is providing an optimal opportunity for the pound investors to enter a firmer reversal.
A double bottom formation on a four-hour scale seems lucrative for the cable bulls. The pair has displayed a sheer upside after retesting March’s lows at around the psychological support of 1.3000. The double bottom chart pattern signifies a bullish reversal amid the absence of high-volume sellers while r-testing the critical bottom. The trendline placed from March 3 high at 1.3418, adjoining the March 23 high at 1.3299 will continue to act as a major barricade. Read more...
Author
FXStreet Team
FXStreet
Composed of a group of economic journalists and FX experts, the FXStreet content team produces and oversees all content published on FXStreet. It provides a purely journalistic approach to the Forex market.