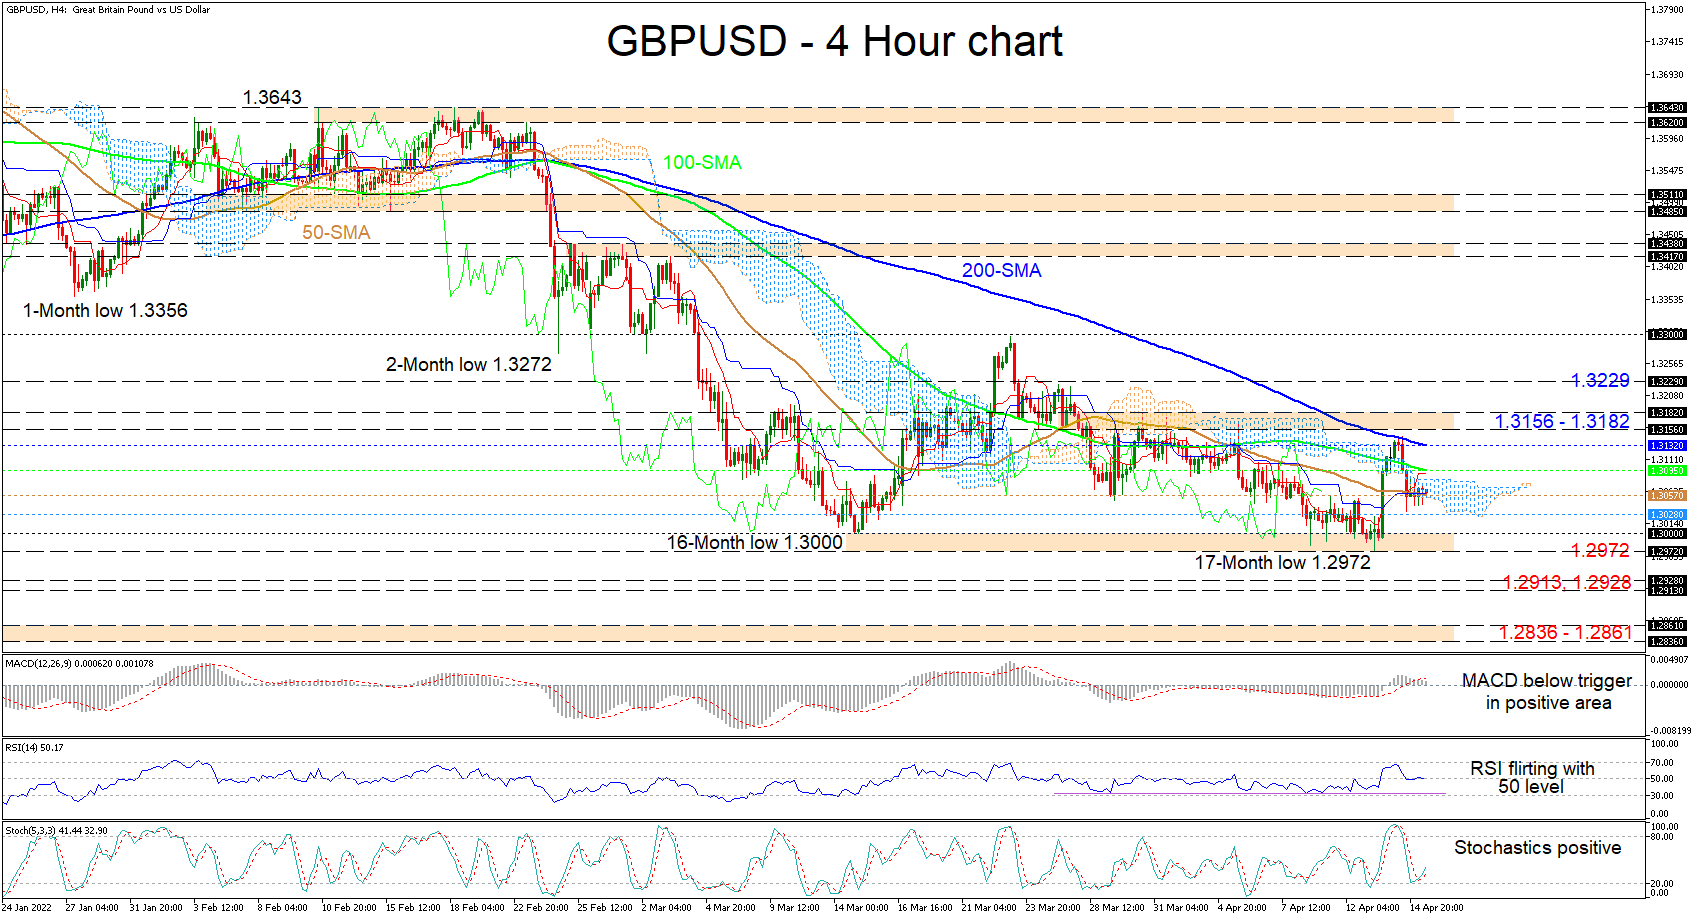
Technical analysis: GBP/USD gains capped by 200-period MA, bearish risks rekindled

GBPUSD’s fresh drop has stabilized around its 50-period simple moving average (SMA), after the scenario of a sturdy rally was dampened by the descending 200-period SMA and the 1.3156-1.3182 barricade overhead. Furthermore, the negative picture in the pair is being nurtured by the downward demeanour of the SMAs.
Currently, the Ichimoku lines are highlighting a state of frail driving forces, while the short-term oscillators are transmitting mixed signals in directional momentum. The MACD, slightly above the zero threshold, is suggesting positive momentum is dwindling, while the stochastic oscillator is promoting bullish impetus. Meanwhile, the RSI is toying with the 50 neutral level, demonstrating no clear winner between buyers and sellers for the moment.
Presently, the pair is consolidating around the 50-period SMA at 1.3057, and a swing lower in the price may meet the support border of 1.3028 prior to sellers challenging the 1.2972-1.3000 foundation that extends back to mid-March. If this key base fails to dismiss negative tendencies from accelerating, the price could then aim for the 1.2928 and the 1.2913 troughs from the start of November 2020. Should the pair remain heavy, the 1.2836-1.2861 support boundary, shaped by the multiple lows over the first part of October 2020 could come under attack.
To begin to feed optimism in the pair, the price would need to surge beyond the Ichimoku cloud and the 100-period SMA at 1.3095. Moving higher, the bulls may then revisit the 200-period SMA at 1.3132 and the neighbouring 1.3156-1.3182 obstacle. Successfully overcoming the bullish spikes from the end of March and the beginning of April, the spotlight could shift towards the 1.3229 barrier before buyers propel for the crucial 1.3300 handle, which is in line with the March peak.
Summarizing, GBPUSD is exhibiting a neutral-to-bearish tone below the recently formed 1.3156-1.3182 ceiling. The negative trajectory would be revived with a break under the 1.2972-1.3000 floor. That said, to reinforce the bullish mood, the pair would need to pilot beyond the 1.3300 hurdle.
Author

Anthony Charalambous joined XM in 2019 and specializes in preparing daily technical analysis, using his years of trading experience to provide detailed forecasting for all major asset classes such as forex, indices, commodities and equities.


