Pound Sterling wobbles against US Dollar, investors await US PPI data
- The Pound Sterling rises against its main currency peers as the market sentiment remains favorable for riskier assets.
- The UK economy is expected to have stagnated in July.
- Investors await key US PPI and CPI data for August.

The Pound Sterling (GBP) trades higher against its major currency peers, except antipodeans, on Wednesday. The British currency demonstrates strength as the market sentiment remains upbeat amid firm expectations that the Federal Reserve (Fed) will cut interest rates next week.
On the domestic data front, investors await the UK Gross Domestic Product (GDP) and the factory data for July, scheduled for Friday. Monthly GDP growth in the United Kingdom (UK) economy is expected to have stagnated after rising by 0.4% in June. Month-on-month Manufacturing and Industrial Production data are also expected to have remained flat.
Signs of cooling UK GDP growth would prompt market expectations for more interest rate cuts by the Bank of England (BoE) in the remainder of the year. Meanwhile, traders expect the BoE to hold interest rates steady at 4% in the monetary policy meeting next week.
Meanwhile, the US Dollar trades calmly as investors digest signs of weakness in the US job market shown by the Nonfarm Payrolls (NFP) Benchmark Revision report released on Tuesday. The report for 12 months ending March 2025 showed that the economy created 911K fewer jobs than had been anticipated earlier.
Pound Sterling Price Today
The table below shows the percentage change of British Pound (GBP) against listed major currencies today. British Pound was the strongest against the Japanese Yen.
| USD | EUR | GBP | JPY | CAD | AUD | NZD | CHF | |
|---|---|---|---|---|---|---|---|---|
| USD | 0.00% | -0.10% | 0.12% | 0.04% | -0.24% | -0.32% | -0.09% | |
| EUR | -0.00% | -0.10% | 0.03% | 0.03% | -0.29% | -0.34% | -0.09% | |
| GBP | 0.10% | 0.10% | 0.18% | 0.14% | -0.16% | -0.22% | 0.05% | |
| JPY | -0.12% | -0.03% | -0.18% | 0.00% | -0.41% | -0.44% | 0.09% | |
| CAD | -0.04% | -0.03% | -0.14% | -0.00% | -0.32% | -0.39% | -0.09% | |
| AUD | 0.24% | 0.29% | 0.16% | 0.41% | 0.32% | -0.05% | 0.22% | |
| NZD | 0.32% | 0.34% | 0.22% | 0.44% | 0.39% | 0.05% | 0.42% | |
| CHF | 0.09% | 0.09% | -0.05% | -0.09% | 0.09% | -0.22% | -0.42% |
The heat map shows percentage changes of major currencies against each other. The base currency is picked from the left column, while the quote currency is picked from the top row. For example, if you pick the British Pound from the left column and move along the horizontal line to the US Dollar, the percentage change displayed in the box will represent GBP (base)/USD (quote).
Daily digest market movers: Pound Sterling trades sideways against US Dollar
- The Pound Sterling trades in a tight range around 1.3530 against the US Dollar (USD) during the European trading session on Wednesday. The GBP/USD pair wobbles as the US Dollar trades calmly ahead of the United States (US) Producer Price Index (PPI) data for August, which will be published at 12:30 GMT.
- Investors will closely monitor the US producer inflation data to gauge the impact of reciprocal and sectoral tariffs imposed by US President Donald Trump. Economists expect the headline PPI to have grown steadily at an annualized pace of 3.3%. Meanwhile, the core PPI – which excludes volatile food and energy items – is estimated to have risen moderately by 3.5%, compared to 3.7% in July. On a monthly basis, both headline and core PPI are expected to have grown at a slower pace of 0.3%.
- Lately, Federal Open Market Committee (FOMC) members have commented that the impact of tariffs on inflation won’t be persistent.
- For more cues on inflation, investors will focus on the US Consumer Price Index (CPI) data for August, which is scheduled for Thursday. The consumer inflation report is expected to show that price pressures grew at a slightly faster pace.
- The US PPI and CPI data will provide cues about the pace at which the Federal Reserve (Fed) will cut interest rates in the policy meeting next week, as traders are already confident that the central bank will initiate the monetary-easing campaign on September 17.
- According to the CME FedWatch tool, traders see an 8.4% chance that the Fed will cut interest rates by 50 basis points (bps) to 3.75%-4.00%, while the rest point a standard 25-bps interest rate reduction.
Technical Analysis: Pound Sterling trades inside Ascending Triangle chart pattern
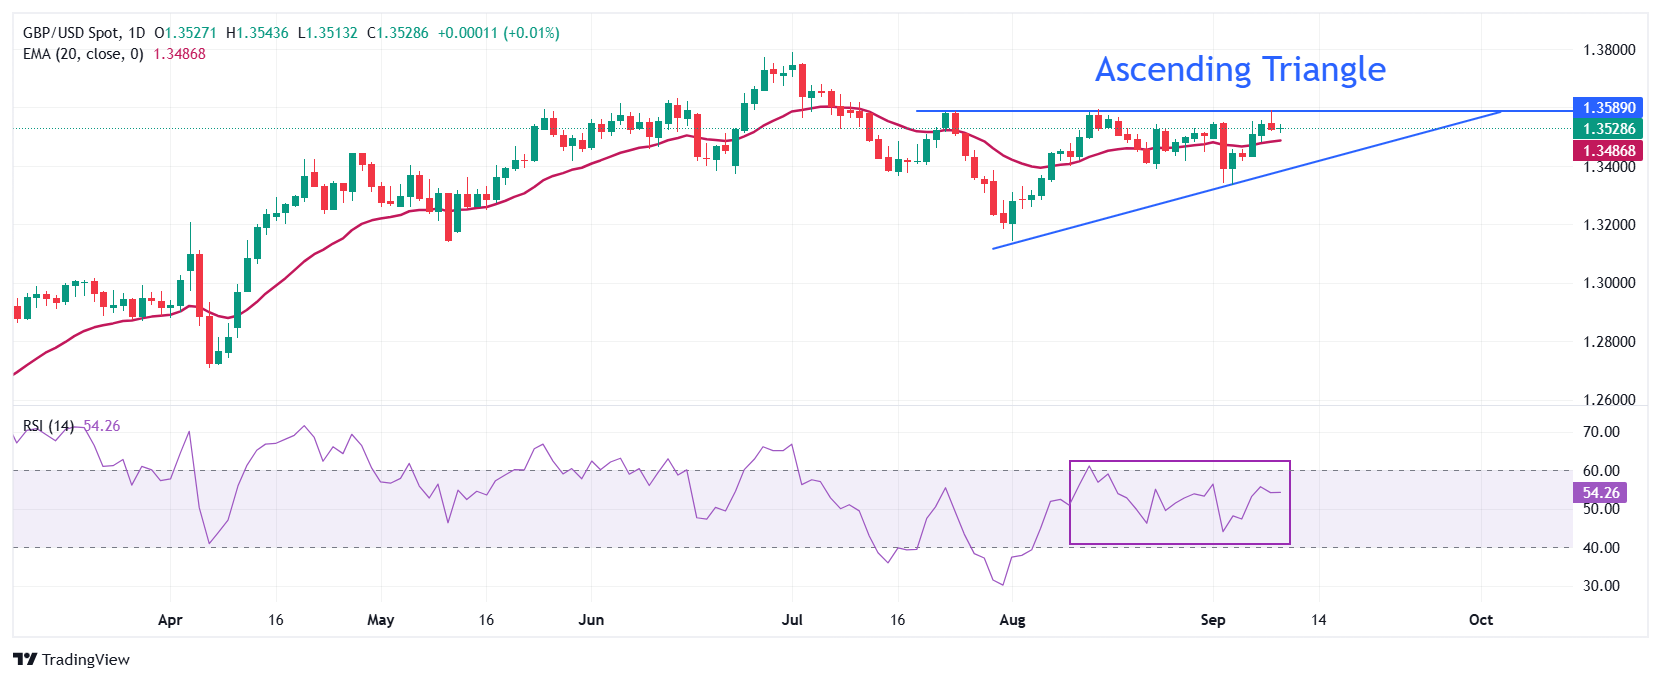
The Pound Sterling consolidates around 1.3530 against the US Dollar on Wednesday. The GBP/USD pair trades inside an Ascending Triangle chart pattern, which indicates indecisiveness among investors. The horizontal resistance of the above-mentioned chart pattern is plotted from the July 23 high around 1.3585, while the upward-sloping border is placed from the August 1 low near 1.3140.
The near-term trend of the Cable remains sideways as it trades close to the 20-day Exponential Moving Average (EMA), which is around 1.3487.
The 14-day Relative Strength Index (RSI) on the daily chart oscillates inside the 40.00-60.00 range, indicating a sideways trend.
Looking down, the August 1 low of 1.3140 will act as a key support zone. On the upside, the July 1 high near 1.3800 will act as a key barrier.
Economic Indicator
Producer Price Index (YoY)
The Producer Price Index released by the Bureau of Labor statistics, Department of Labor measures the average changes in prices in primary markets of the US by producers of commodities in all states of processing. Changes in the PPI are widely followed as an indicator of commodity inflation. Generally speaking, a high reading is seen as positive (or bullish) for the USD, whereas a low reading is seen as negative (or bearish).
Read more.Next release: Wed Sep 10, 2025 12:30
Frequency: Monthly
Consensus: 3.3%
Previous: 3.3%
Source: US Bureau of Labor Statistics
Author

Sagar Dua
FXStreet
Sagar Dua is associated with the financial markets from his college days. Along with pursuing post-graduation in Commerce in 2014, he started his markets training with chart analysis.