Potential head and shoulders patterns in US stock markets
Emini S&P September futures broke out to the downside of the 10 day range is with a break below 5575/5560
The low & high for the last session were 5595 - 5665.
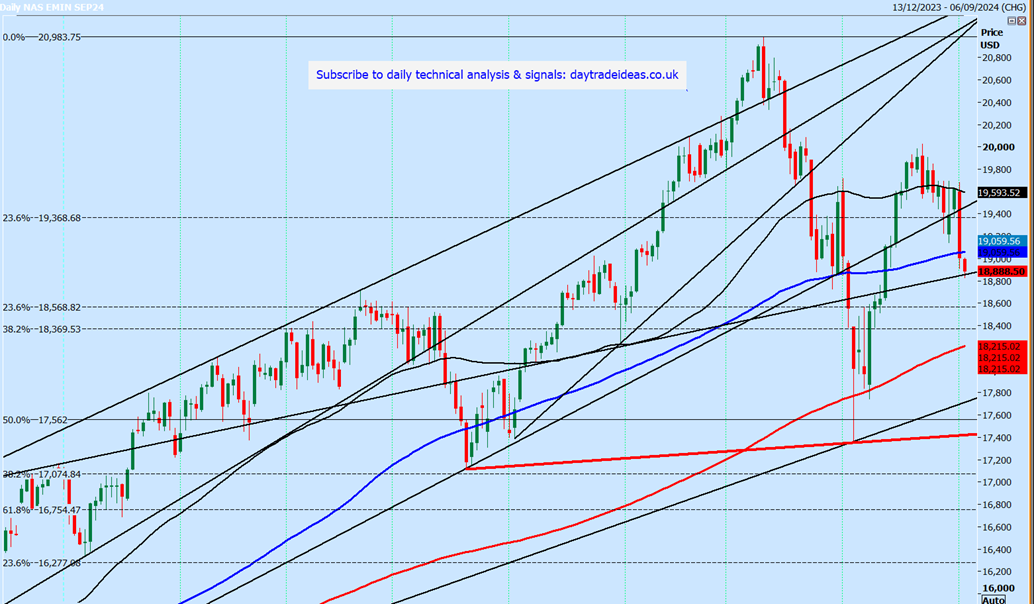
Emini Nasdaq September collapsed from resistance at 19690/695.
Last session high & low for the SEPTEMBER futures contract: 18911 - 19683.
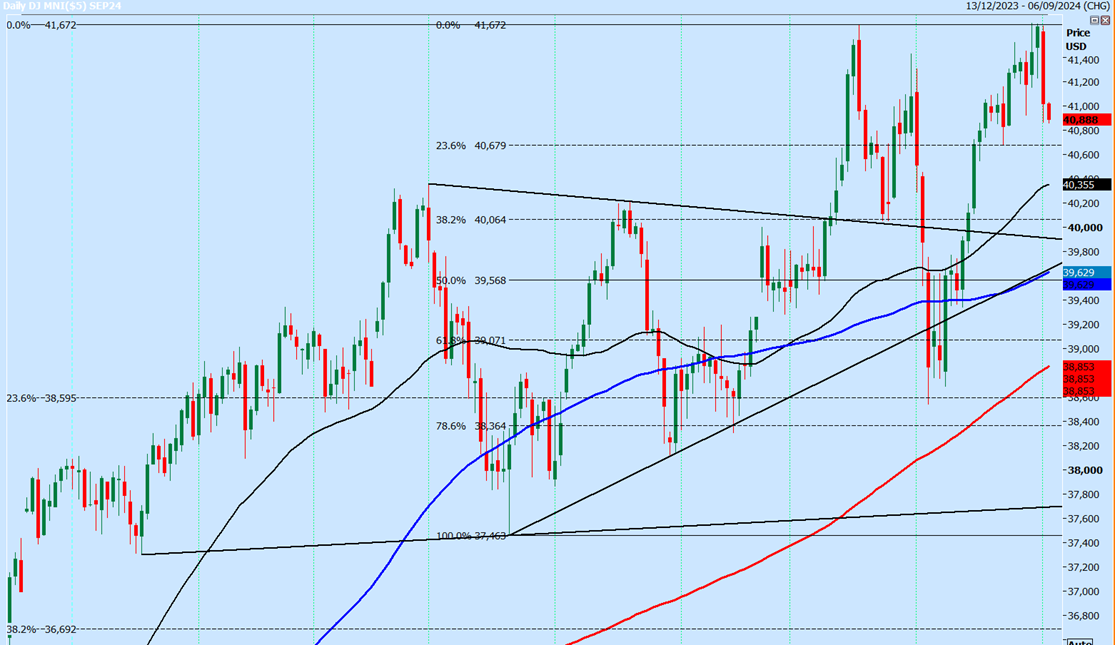
Emini Dow Jones September has a potential double top sell signal after the collapse from the new all time high at 41682.
Last session high & low for the SEPTEMBER futures contract: 41658 - 40866.
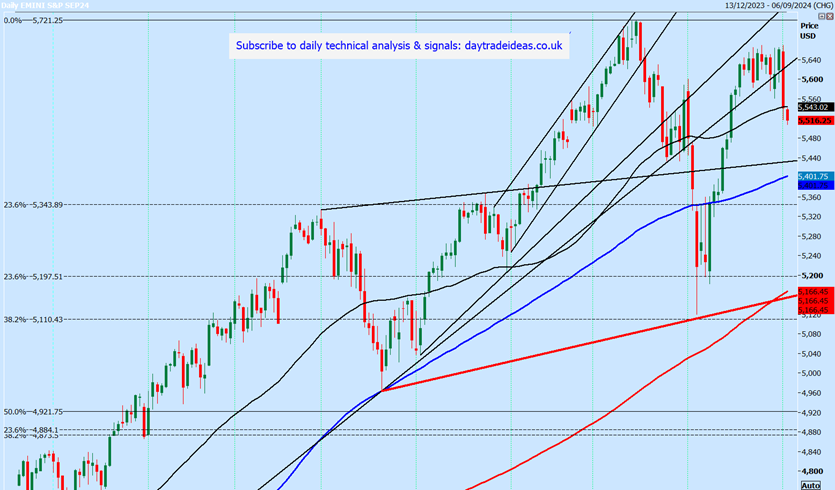
Emini S&P September futures
Emini S&P has now started to move with a break below the lower end of the 10 day range at 5575/5560 hitting 1st target of 5540/30 & almost as far as 5500/5490.
It seems possible we could fall as far as 5470/60 but there is a good chance of a low for the day here.
Longs need stops below 5450.
I could argue that we could be forming a (very lobsided) 6 month head & shoulders pattern with neckline at 5180/50.
We should meet resistance at 5540/50 & shorts need stops above 5560.
However if we continue higher we risk getting trapped in the recent range, so I will see where we close tonight.
Nasdaq September futures
The 10% collapse in Invida pulled stocks lower yesterday & obviously the Nasdaq was hit hard.
I have been warning & watching for the formation of a right shoulder in a 6 month head & shoulders pattern
Of course this looks more likely to form after we collapsed from minor resistance at the Tuesday/Wednesday/Thursday high of 19690/695 yesterday.
We wrote: a dip below 19500 risks a slide towards last week's low at 19140 & perhaps as far as support at the 100 day moving average at 19065/025. A break below here targets 18880/830.
Although I did not expect that move to happen within hours, if you did manage to get in to a short position ono the break of 19500, there was up to 600 ticks profit possible as we hit the 18830 target.
The index is oversold in the short term & we are testing a 2 year ascending trend line so there is a good chance of a bounce from 18880/18830. Longs need a 100 ticks stop loss below the short term Fibonacci levels around 18700.
A break below 18700 should be another sell signal targeting strong Fibonacci support at 18600/500, with a good chance of a low for the day here.

Emini Dow Jones September futures
We wrote: ...failure to break above the all time high leaves a potential double top pattern, which would trigger a move towards 41160/100 & 40950/900...Look for short term support at 40700/650. Longs need stops below 40550.
Well, quite a move yesterday as we collapsed to my targets of 41160/100 & 40950/900, with a low for the day only about 30 ticks below.
To repeat: Look for short term support at 40700/650. Longs need stops below 40550.
A break lower see 40650/700 act as resistance targeting further losses towards 40400/350 & perhaps as far as 40100.
I think gains are likely to be limited as downside risks suddenly open & we should have resistance at 41150/200 than at 41350/390.
Author

Jason Sen
DayTradeIdeas.co.uk


