PayPal Holdings Inc. (PYPL) Elliott Wave technical analysis [Video]
![PayPal Holdings Inc. (PYPL) Elliott Wave technical analysis [Video]](https://editorial.fxstreet.com/images/TechnicalAnalysis/ChartPatterns/Chartism/financial-graph-19311174_XtraLarge.jpg)
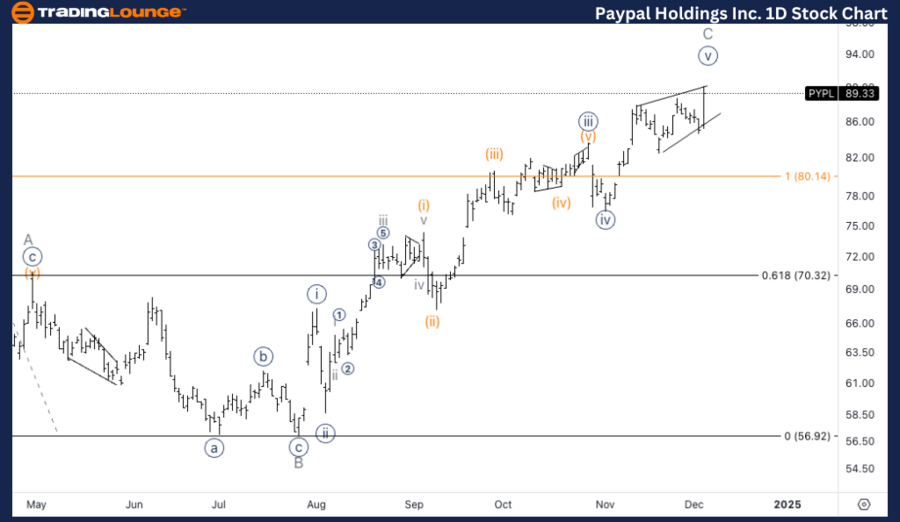
PYPL Elliott Wave technical analysis
Function: Trend
Mode: Impulsive
Structure: Motive
Position: Wave {v} of C.
Direction: Upside into wave {v}.
Details: Looking for a potential ending diagonal in wave {v} as we approach 90$. We have passed equality of potential C vs. A which also makes us think we could be in a wave 3 instead.
PYPL Elliott Wave technical analysis – Daily chart
PYPL is advancing within wave {v} of wave C, possibly forming an ending diagonal as it approaches the key resistance level at $90. The equality of wave C relative to wave A has been surpassed, which introduces the possibility that instead of an ending diagonal, this could be part of wave 3 in a larger impulsive structure. The focus is on whether PYPL will complete this motive structure or transition into a more extended bullish phase.
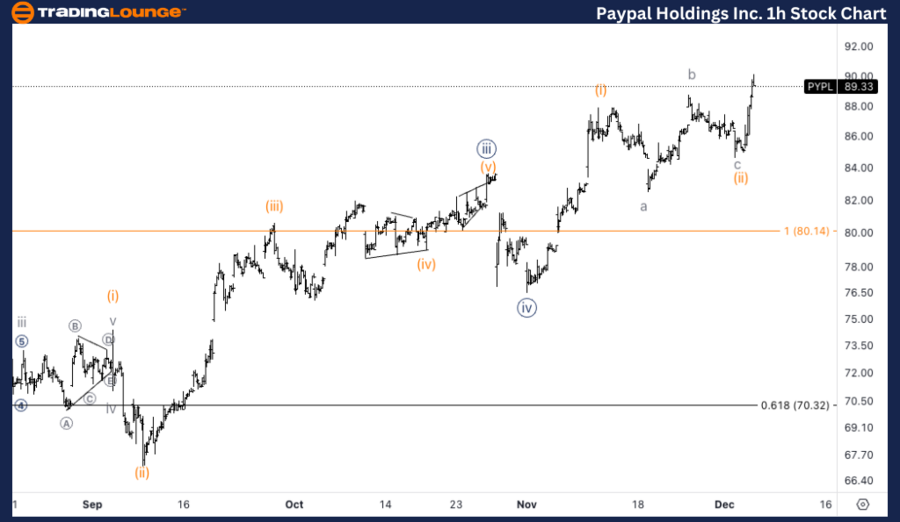
PYPL Elliott Wave technical analysis
Function: Trend
Mode: Impulsive
Structure: Motive
Position: Wave (iii) of {v}.
Direction: Upside in wave (iii).
Details: Here we are exploring the possibility of further upside in wave {v} towards TradingLvel1 at 100$. Looking for upside into wave (iii).
PYPL Elliott Wave technical analysis – One-hour chart
On the 1-hour chart, PYPL is likely within wave (iii) of {v}, aiming for further upside momentum. The price is expected to move higher towards TradingLevel1 at $100, driven by the bullish continuation of wave (iii) within the overall structure of wave {v}. This suggests a stronger upside push in the near term.
This Elliott Wave analysis of PayPal Holdings Inc., (PYPL) outlines both the daily and 1-hour chart structures, highlighting the current trends and possible future price movements.
PayPal Holdings Inc. (PYPL) Elliott Wave technical analysis [Video]
Author

Peter Mathers
TradingLounge
Peter Mathers started actively trading in 1982. He began his career at Hoei and Shoin, a Japanese futures trading company.


