Palladium Price Analysis: XPD/USD eases from nine-month-old resistance to $2,300
- Palladium snaps seven-day uptrend near the highest levels since September 2021.
- Overbought RSI, failures to cross the key resistance line signals further weakness.
- 200-DMA, three-month-old horizontal support lures short-term sellers while bulls have a bumpy road to the north.
Palladium (XPD/USD) takes offers around $2,304, down 1.26% intraday, as the market’s risk-off mood drown commodities heading into Thursday’s European session.
In doing so, the bullion prices take a U-turn from a descending trend line from May 2021. Given the overbought RSI conditions, the latest declines are likely to last longer.
The same highlights the 200-DMA and a horizontal resistance-turned-support area from October 2021, respectively around $2,210 and $2,185, for XPD/USD sellers.
In a case where palladium prices drop below $2,185, the $2,000 psychological magnet and December 2021 top near $1,997, should return to the chart.
Alternatively, the metal’s run-up beyond the stated resistance line, near $2,340 by the press time, will aim for the 61.8% Fibonacci retracement of May-December 2021 downside, close to $2,460.
Following that, the XPD/USD bulls will have a free hand to aim for the $3,000 round figure with tops marked in July around $1,720 and $2,880 likely acting as buffers.
Palladium: Daily chart
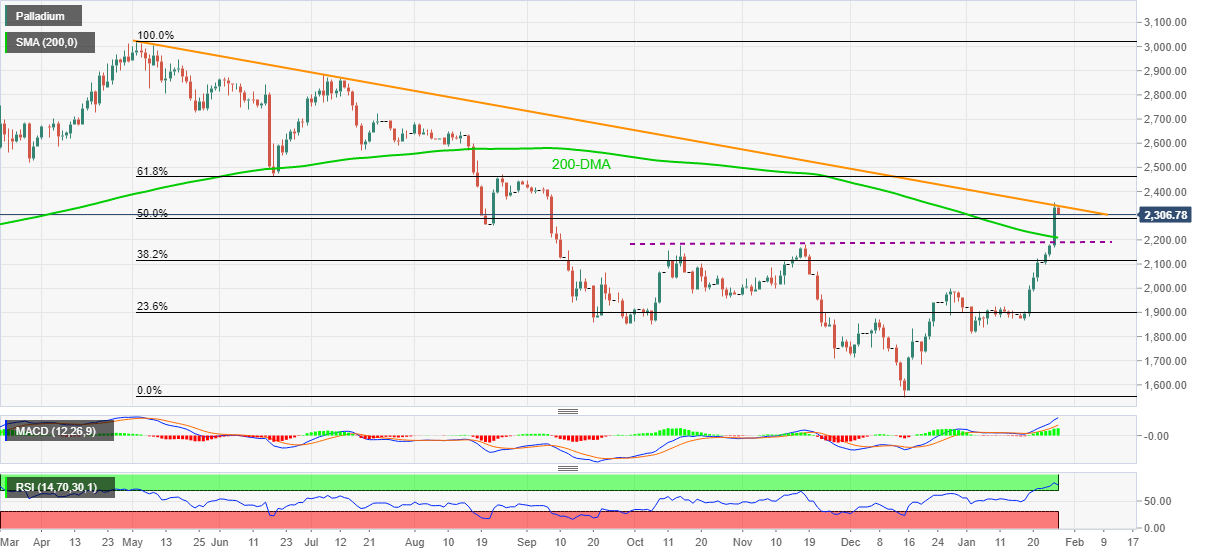
Trend: Pullback expected
Author

Anil Panchal
FXStreet
Anil Panchal has nearly 15 years of experience in tracking financial markets. With a keen interest in macroeconomics, Anil aptly tracks global news/updates and stays well-informed about the global financial moves and their implications.


