Palladium Price Analysis: XPD/USD bulls challenge 20-day SMA
- Palladium notches higher in the early European session on Thursday.
- Bulls hold the key support area near $2,620, making it a crucial level to trade.
- Momentum oscillator remained in oversold zone with a neutral stance.
Palladium (XPD/USD) edges higher on Thursday following the previous session’s decline on Thursday. The metal hovers in a very narrow trade band with an underlying bullish sentiment.
At the time of writing, XPD/USD is trading at, $2,626, up 0.09% for the day.
Palladium four-hour chart
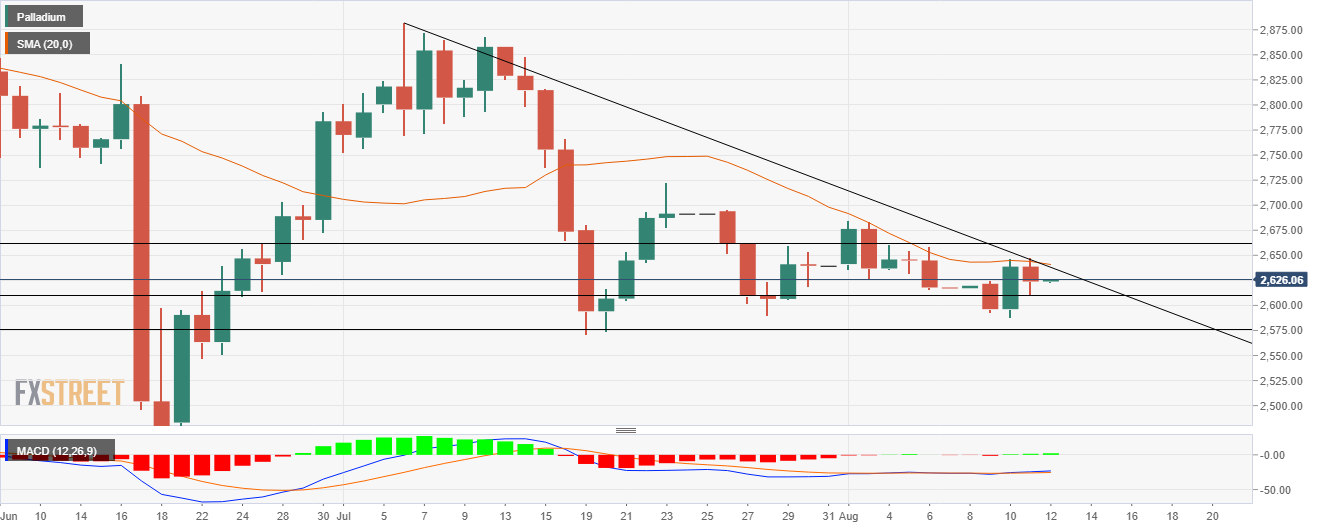
On the daily chart, after making the high at $2,882.78 on July 6, XPD/USD has been under constant selling pressure. The descending trendline from the top acts as a strong resistance barrier for the bulls.
Being said, if prices attempt to break intraday high, it could meet the 20-day Simple Moving Average (SMA) at $2,640 as the first upside target.
A daily close above the mentioned level will coincide with the breaking of the bearish sloping line adding more optimism for XPD/USD bulls.
Bulls will attempt to recapture the $2,655 horizontal resistance level followed by the high of August 3 at $2,683.29.
Alternatively, if price moves lower, it could retrace back to the $2,610 horizontal support level.
Any downtick in the Moving Average Convergence Divergence (MACD) would amplify the selling pressure toward the low of August 10 at $2,588.
The next area of support would be the $2,575 horizontal support level.
Palladium additional levels
Author

Rekha Chauhan
Independent Analyst
Rekha Chauhan has been working as a content writer and research analyst in the forex and equity market domain for over two years.


