- Palladium gradually overcomes three-month low, up for second positive day.
- 50% Fibonacci retracement, 100-DMA guards immediate upside, multiple horizontal lines test the bulls afterward.
- Late March low, 61.8% Fibonacci retracement restrict short-term downside.
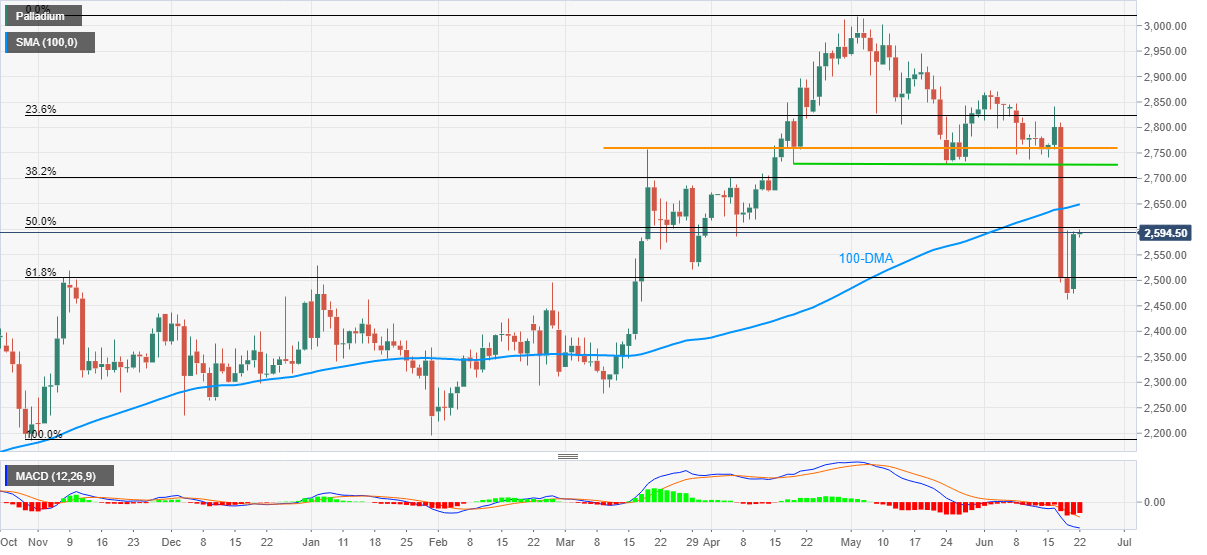
Palladium (XPD/USD) holds onto the previous day’s recovery moves from mid-March lows, taking rounds to $2,595 heading into Tuesday’s European session. In doing so, the precious metal gains 0.14% intraday as it battles the 50% Fibonacci retracement (Fibo.) of October 2020 to May 2021 upside.
Given the receding bearish bias of MACD and the commodity’s sustained trading above the key Fibonacci retracement, namely the 61.8% Fibo., Palladium buyers can cross the immediate hurdle surrounding $2,600. However, the quote's further upside will be probed by 100-day SMA (DMA) level near $2,650.
During the XPD/USD upside past $2,650, 38.2% Fibonacci retracement around $2,705 holds the key to the run-up towards two horizontal lines, stretched from late April and March, respectively around $2,730 and $2,760.
Alternatively, $2,560 may entertain the intraday sellers ahead of directing them to 61.8% Fibo. retest, near $2,505.
If at all the commodity prices fails to stay beyond $2,500, the latest low near $2,460 adds to the downside filters.
Overall, palladium remains on the recovery mode but multiple hurdles test the bulls and can offer intermediate pullbacks.
Palladium daily chart
Trend: Further recovery expected
Information on these pages contains forward-looking statements that involve risks and uncertainties. Markets and instruments profiled on this page are for informational purposes only and should not in any way come across as a recommendation to buy or sell in these assets. You should do your own thorough research before making any investment decisions. FXStreet does not in any way guarantee that this information is free from mistakes, errors, or material misstatements. It also does not guarantee that this information is of a timely nature. Investing in Open Markets involves a great deal of risk, including the loss of all or a portion of your investment, as well as emotional distress. All risks, losses and costs associated with investing, including total loss of principal, are your responsibility. The views and opinions expressed in this article are those of the authors and do not necessarily reflect the official policy or position of FXStreet nor its advertisers. The author will not be held responsible for information that is found at the end of links posted on this page.
If not otherwise explicitly mentioned in the body of the article, at the time of writing, the author has no position in any stock mentioned in this article and no business relationship with any company mentioned. The author has not received compensation for writing this article, other than from FXStreet.
FXStreet and the author do not provide personalized recommendations. The author makes no representations as to the accuracy, completeness, or suitability of this information. FXStreet and the author will not be liable for any errors, omissions or any losses, injuries or damages arising from this information and its display or use. Errors and omissions excepted.
The author and FXStreet are not registered investment advisors and nothing in this article is intended to be investment advice.
Recommended content
Editors’ Picks

EUR/USD holds steady near 1.1500 after mixed PMI data
EUR/USD trades at around 1.1500 after starting the week on a bearish note. The cautious market stance amid the deepening Middle East conflict and mixed PMI data releases from Germany and the Eurozone cap the pair's upside as focus shifts to US data.

Could Iran block the Strait of Hormuz? Why Oil is on edge after US strikes
As the Israel-Iran conflict reaches new heights, an old threat is coming back to haunt the markets: that of the closure of the Strait of Hormuz. This narrow arm of the sea in the Persian Gulf, wedged between Iran to the north and the United Arab Emirates and Oman to the south, is much more than a simple sea passage.

Gold price hangs near daily low amid modest USD strength; downside seems cushioned
Gold price retains its negative bias through the first half of the European session on Monday and currently trades near the lower end of its daily range. The US attack on Iran’s nuclear facilities on Sunday raises the risk of a broader conflict in the Middle East and benefits the US Dollar's status as the global reserve currency.

Solana Price Forecast: SOL recovers after hitting 2-month low amid US attack on Iran
Solana (SOL) recovers slightly, trading at around $134 at the time of writing on Monday after dipping to a two-month low of $126 the previous day. This price correction was triggered by the rising jitters as the US struck Iran over the weekend, sparking risk aversion in the crypto markets.

GBP/USD holds recovery above 1.3400, with eyes on UK PMI, Middle East woes
GBP/USD is holding its rebound above 1.3400 in the European session on Monday. The fears that Iran would retaliate against US attacks on its nuclear sites continue to support the safe-haven US Dollar. Investors await the June preliminary PMI readings from the UK and the US for fresh trading directives.

The Best brokers to trade EUR/USD
SPONSORED Discover the top brokers for trading EUR/USD in 2025. Our list features brokers with competitive spreads, fast execution, and powerful platforms. Whether you're a beginner or an expert, find the right partner to navigate the dynamic Forex market.