|

Palladium Price Analysis: Drops towards $2,400 on weekly support break

  • Palladium takes offers to refresh intraday low, prints three-day downtrend.
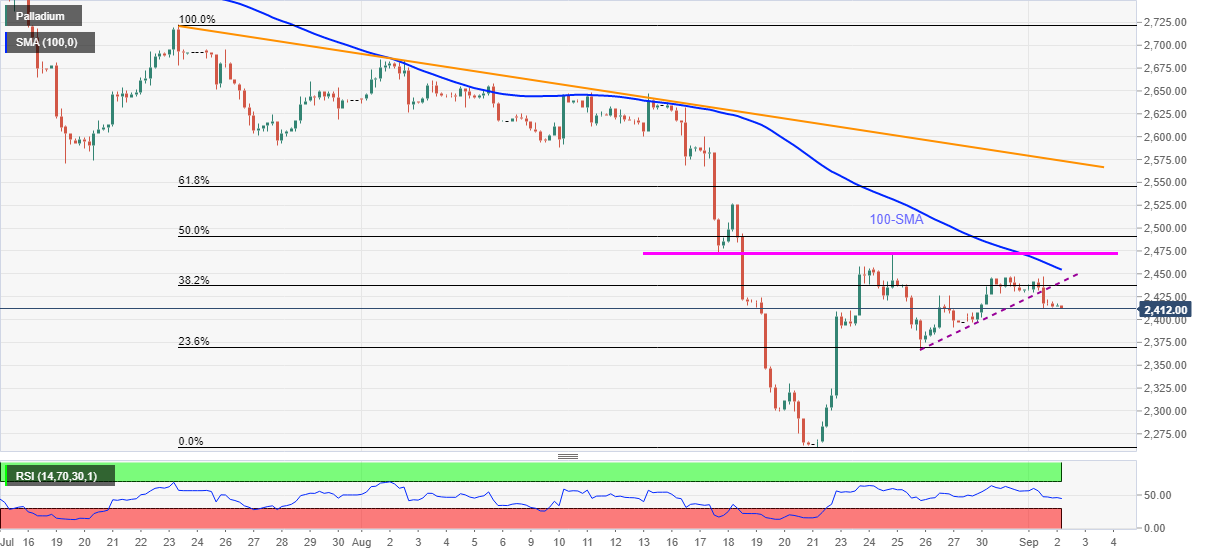
  • Downward sloping RSI, failures to cross 100-SMA also strengthen bearish bias.
  • Bulls may refrain from entries unless crossing six-week-old falling trend line.

Palladium (XPD/USD) remains on the back foot for the third consecutive day, refreshes intraday bottom around $2,412 heading into Thursday’s European session.

Having failed to cross 100-SMA, the precious metal broke an ascending trend line from August 26 the previous day. The same joins descending RSI line to keep sellers hopeful.

Hence, the latest swing low, comprising 23.6% Fibonacci retracement of July 23 to August 23 downside around $2,370, lures the XPD/USD bears for now.

However, a clear downside past $2,370 won’t step back from challenging the last month’s low of $2,260. During the fall, August 20 peak surrounding $2,330 and the $2,300 threshold may offer intermediate halts.

Meanwhile, corrective pullback needs to cross the previous support and 100-SMA, respectively around $2,440 and $2,455, to justify the capacity of rebound.

Even if the quote manages to rise past $2,455, a 12-day-old horizontal hurdle near $2,473 and descending trend line from July 23, close to $2,575, will be crucial for the palladium buyers.

Palladium: Four-hour chart

Trend: Further weakness expected

Additional important levels

Overview
Today last price2412.81
Today Daily Change-4.36
Today Daily Change %-0.18%
Today daily open2417.17
 
Trends
Daily SMA202460.81
Daily SMA502597.63
Daily SMA1002703.42
Daily SMA2002578.18
 
Levels
Previous Daily High2446.72
Previous Daily Low2412.13
Previous Weekly High2471.73
Previous Weekly Low2260.56
Previous Monthly High2684.23
Previous Monthly Low2260.56
Daily Fibonacci 38.2%2425.34
Daily Fibonacci 61.8%2433.51
Daily Pivot Point S12403.96
Daily Pivot Point S22390.75
Daily Pivot Point S32369.37
Daily Pivot Point R12438.55
Daily Pivot Point R22459.93
Daily Pivot Point R32473.14

Author

Anil Panchal

Anil Panchal

FXStreet

Anil Panchal has nearly 15 years of experience in tracking financial markets. With a keen interest in macroeconomics, Anil aptly tracks global news/updates and stays well-informed about the global financial moves and their implications.

More from Anil Panchal
Share:

Editor's Picks

EUR/USD looks sidelined around 1.1850

EUR/USD remains on the back foot, extending its bearish tone and sliding towards the 1.1850 area to print fresh daily lows on Monday. The move lower comes as the US Dollar gathers modest traction, with thin liquidity and subdued volatility amplifying price swings amid the US market holiday.

GBP/USD flirts with daily lows near 1.3630

GBP/USD has quickly given back Friday’s solid gains, turning lower at the start of the week and drifting back towards the 1.3630 area. The focus now shifts squarely to Tuesday’s UK labour market report, which is likely to keep the quid firmly in the spotlight and could set the tone for Cable’s next move.

Gold battle around $5,000 continues

Gold is giving back part of Friday’s sharp rebound, deflating below the key $5,000 mark per troy ounce as the new week gets underway. Modest gains in the US Dollar are keeping the metal in check, while thin trading conditions, due to the Presidents Day holiday in the US, are adding to the choppy and hesitant tone across markets.

Bitcoin consolidates as on-chain data show mixed signals

Bitcoin price has consolidated between $65,700 and $72,000 over the past nine days, with no clear directional bias. US-listed spot ETFs recorded a $359.91 million weekly outflow, marking the fourth consecutive week of withdrawals.

The week ahead: Key inflation readings and why the AI trade could be overdone

It is likely to be a quiet start to the week, with US markets closed on Monday for Presidents Day. European markets are higher across the board and gold is clinging to the $5,000 level after the tamer than expected CPI report in the US reduced haven flows to precious metals.

XRP steadies in narrow range as fund inflows, futures interest rise

Ripple is trading in a narrow range between $1.45 (immediate support) and $1.50 (resistance) at the time of writing on Monday. The remittance token extended its recovery last week, peaking at $1.67 on Sunday from the weekly open at $1.43.