Palladium Price Analysis: 20-DMA triggers XPD/USD pullback from weekly top


  • Palladium consolidates recent gains after four-day uptrend, refreshes intraday low at the latest.
  • 10-DMA, bullish MACD signals challenge sellers, five-month-old resistance line adds to the upside filters.

Palladium (XPD/USD) stays pressured around an intraday low of $1,851.70, down 0.37% on a day as European traders brace for Wednesday’s bell.

In doing so, the bullish prices print daily losses for the first time in three days while stepping back from a one-week high. The pullback moves could also be linked to the quote’s failures to cross the 20-DMA level.

Even so, XPD/USD trading beyond 10-DMA and bullish MACD signals keep buyers hopeful of overcoming the immediate hurdle, namely the 20-DMA level of $1,871.

Following that, the $1,900 threshold and late October’s swing low surrounding $1,955 may tet the bulls before directing them to the $2,000 psychological magnet.

During the palladium’s run-up beyond the $2,000 mark, a multi-day-old resistance line near $2,072 and a two-month-old horizontal area surrounding $2,175 will be crucial to watch.

Alternatively, a downside break of 10-DMA level of $1,800 will re-open doors for the XPD/USD sellers to aim for the yearly low of around $1,695.

In a case where palladium bears dominate past $1,695, a March 2020 low of $1,494 should gain the market’s attention.

Palladium: Daily chart

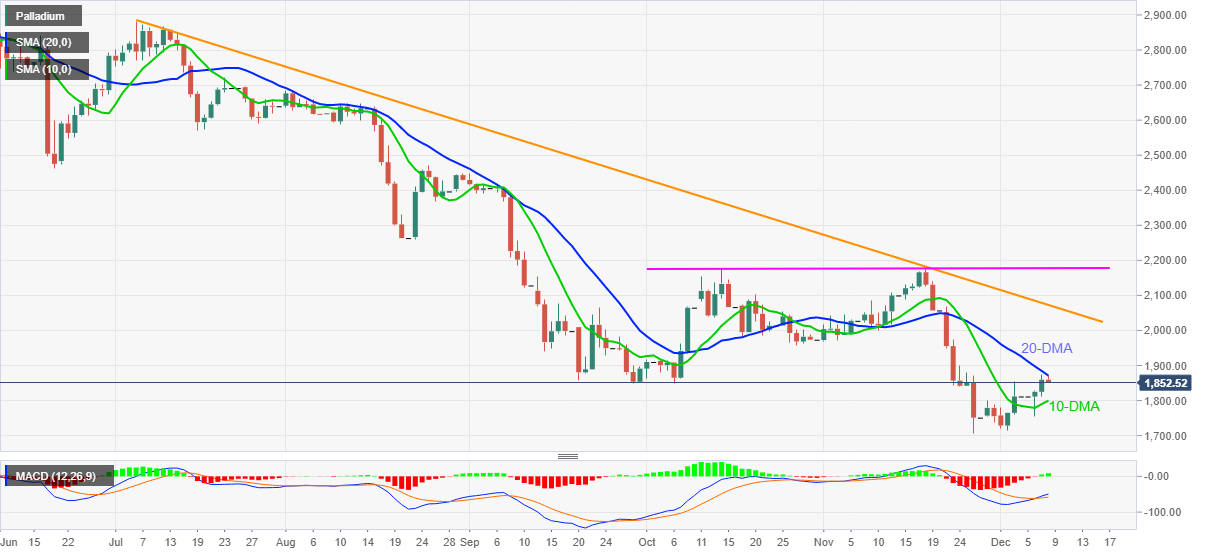
Trend: Further recovery expected

Additional important levels

Overview
Today last price 1852.38
Today Daily Change -7.25
Today Daily Change % -0.39%
Today daily open 1859.63
 
Trends
Daily SMA20 1884.61
Daily SMA50 1973.78
Daily SMA100 2070.5
Daily SMA200 2412.89
 
Levels
Previous Daily High 1875.03
Previous Daily Low 1811.53
Previous Weekly High 1853.75
Previous Weekly Low 1714.76
Previous Monthly High 2178.99
Previous Monthly Low 1707.48
Daily Fibonacci 38.2% 1850.77
Daily Fibonacci 61.8% 1835.79
Daily Pivot Point S1 1822.43
Daily Pivot Point S2 1785.23
Daily Pivot Point S3 1758.93
Daily Pivot Point R1 1885.93
Daily Pivot Point R2 1912.23
Daily Pivot Point R3 1949.43


Share: Feed news

Information on these pages contains forward-looking statements that involve risks and uncertainties. Markets and instruments profiled on this page are for informational purposes only and should not in any way come across as a recommendation to buy or sell in these assets. You should do your own thorough research before making any investment decisions. FXStreet does not in any way guarantee that this information is free from mistakes, errors, or material misstatements. It also does not guarantee that this information is of a timely nature. Investing in Open Markets involves a great deal of risk, including the loss of all or a portion of your investment, as well as emotional distress. All risks, losses and costs associated with investing, including total loss of principal, are your responsibility. The views and opinions expressed in this article are those of the authors and do not necessarily reflect the official policy or position of FXStreet nor its advertisers. The author will not be held responsible for information that is found at the end of links posted on this page.

If not otherwise explicitly mentioned in the body of the article, at the time of writing, the author has no position in any stock mentioned in this article and no business relationship with any company mentioned. The author has not received compensation for writing this article, other than from FXStreet.

FXStreet and the author do not provide personalized recommendations. The author makes no representations as to the accuracy, completeness, or suitability of this information. FXStreet and the author will not be liable for any errors, omissions or any losses, injuries or damages arising from this information and its display or use. Errors and omissions excepted.

The author and FXStreet are not registered investment advisors and nothing in this article is intended to be investment advice.

Recommended content


Recommended content

Editors’ Picks

EUR/USD hovers around 1.0700 ahead of German IFO survey

EUR/USD hovers around 1.0700 ahead of German IFO survey

EUR/USD is consolidating recovery gains at around 1.0700 in the European morning on Wednesday. The pair stays afloat amid strong Eurozone business activity data against cooling US manufacturing and services sectors. Germany's IFO survey is next in focus. 

EUR/USD News

USD/JPY refreshes 34-year high, attacks 155.00 as intervention risks loom

USD/JPY refreshes 34-year high, attacks 155.00 as intervention risks loom

USD/JPY is renewing a multi-decade high, closing in on 155.00. Traders turn cautious on heightened risks of Japan's FX intervention. Broad US Dollar rebound aids the upside in the major. US Durable Goods data are next on tap. 

USD/JPY News

Gold: Defending $2,318 support is critical for XAU/USD

Gold: Defending $2,318 support is critical for XAU/USD

Gold price is nursing losses while holding above $2,300 early Wednesday, stalling its two-day decline, as traders look forward to the mid-tier US economic data for fresh cues on the US Federal Reserve interest rates outlook.

Gold News

Worldcoin looks set for comeback despite Nvidia’s 22% crash Premium

Worldcoin looks set for comeback despite Nvidia’s 22% crash

Worldcoin (WLD) price is in a better position than last week's and shows signs of a potential comeback. This development occurs amid the sharp decline in the valuation of the popular GPU manufacturer Nvidia.

Read more

Three fundamentals for the week: US GDP, BoJ and the Fed's favorite inflation gauge stand out Premium

Three fundamentals for the week: US GDP, BoJ and the Fed's favorite inflation gauge stand out

While it is hard to predict when geopolitical news erupts, the level of tension is lower – allowing for key data to have its say. This week's US figures are set to shape the Federal Reserve's decision next week – and the Bank of Japan may struggle to halt the Yen's deterioration. 

Read more

Forex MAJORS

Cryptocurrencies

Signatures