|

Oil Technical Analysis: WTI trading to daily lows near $63.60 a barrel
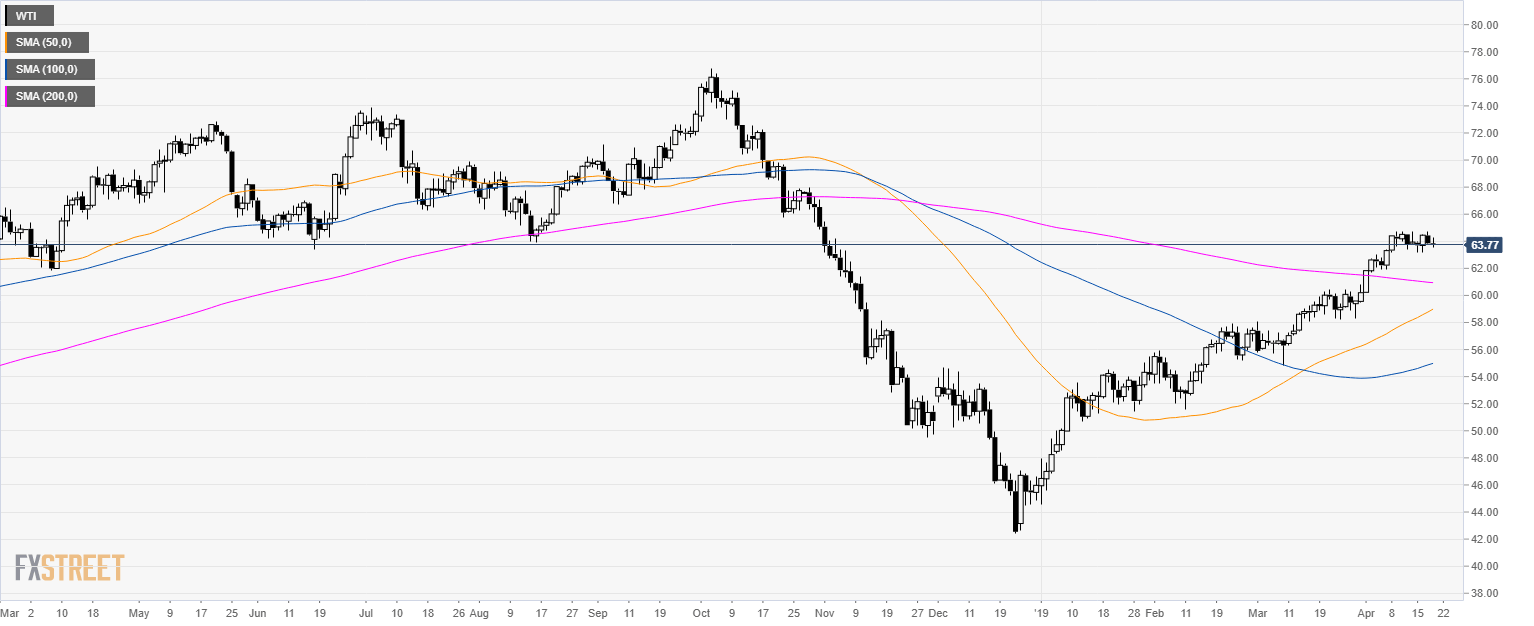
Oil daily chart

  • WTI is trading in a bull trend above its main simple moving averages (SMAs).
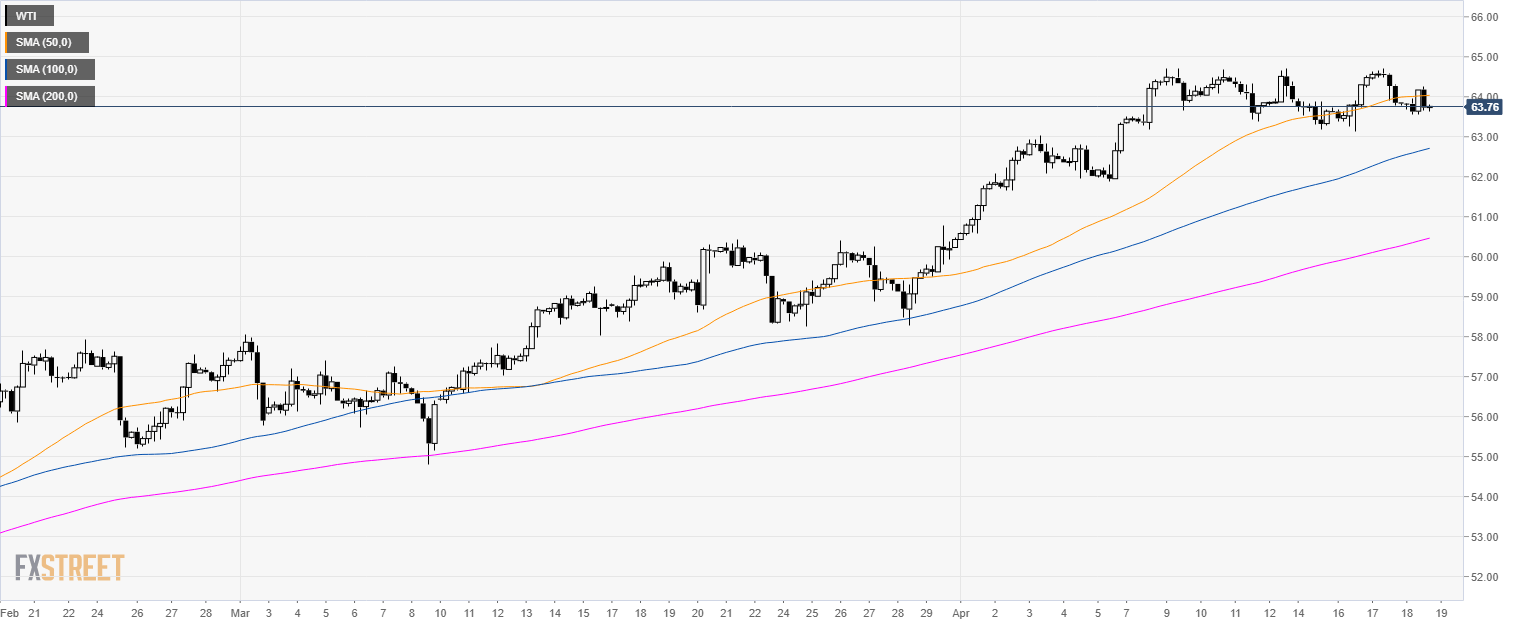

Oil 4-hour chart

  • Crude oil WTI is trading below $64.00 a barrel and its main 50 SMA suggesting a potential correction in the medium-term.
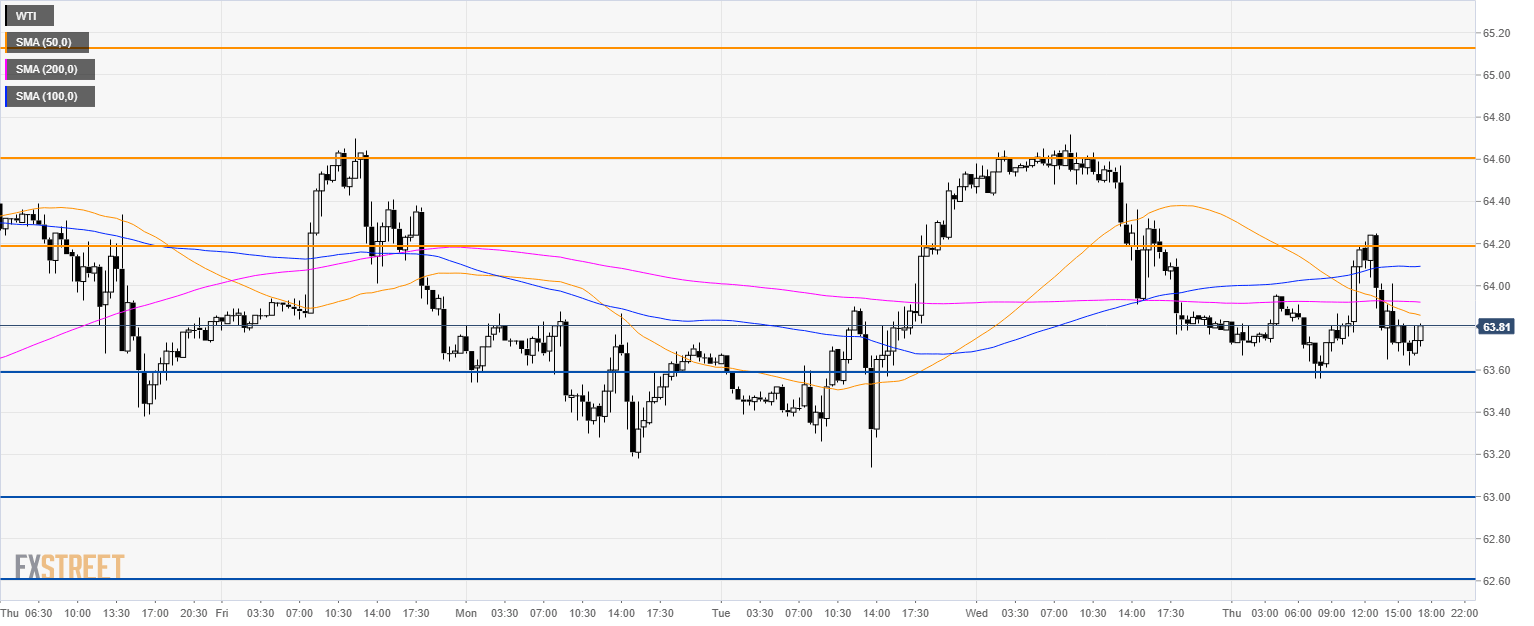

Oil 30-minute chart

  • Crude oil WTI is trading below its main SMAs suggesting a bearish bias in the short-term.
  • Bears need to break below 63.60 in order to reach 63.00 figure.
  • If 63.60 support holds then 64.20 and 64.60 resistances are back in play. 

Additional key levels

WTI

Overview
Today last price63.78
Today Daily Change-0.07
Today Daily Change %-0.11
Today daily open63.85
 
Trends
Daily SMA2062.13
Daily SMA5058.77
Daily SMA10054.88
Daily SMA20060.64
Levels
Previous Daily High64.72
Previous Daily Low63.77
Previous Weekly High64.71
Previous Weekly Low63.17
Previous Monthly High60.78
Previous Monthly Low54.79
Daily Fibonacci 38.2%64.13
Daily Fibonacci 61.8%64.36
Daily Pivot Point S163.51
Daily Pivot Point S263.16
Daily Pivot Point S362.56
Daily Pivot Point R164.46
Daily Pivot Point R265.06
Daily Pivot Point R365.41

Author

Flavio Tosti

Flavio Tosti

Independent Analyst


More from Flavio Tosti
Share:

Editor's Picks

EUR/USD flirts with weekly lows near 1.1770

EUR/USD now comes under further selling pressure, breaking below the 1.1800 support to challenge the area of weekly throughs near 1.1770 on Thursday. The pair’s decline comes in response to marked gains in the US Dollar amid steady geopolitical tensions. Ealier in the day, the ECB’s Lagarde delivered cautious remarks, although the currency remained apathetic.

GBP/USD threatens the 200-day SMA near 1.3440

GBP/USD rapidly leaves behind Wednesday’s strong advance, coming under heavy pressure and retesting the 1.3440 zone, where the critical 200-day SMA is located. Cable’s deep pullback follows the strong gains in the Greenback, while investors continue to pencil in a potential BoE rate cut in March.

Gold trims gains, slips back to around $5,170

Gold is now facing some downside pressure, hovering around the $5,170 region on Thursday. The yellow metal surrenders part of its earlier gains on the back of the resurgence of the buying interest in the Greenback. In the meantime, geopolitical tensions in the Middle East continue to limit the downside potential for now.

Stellar: Relief bounce fades as bearish undertone persists

Stellar is trading around $0.16 at the time of writing on Thursday after rebounding more than 8% in the previous day. Derivatives data paints a negative picture as XLM’s short bets hit a monthly high while Open Interest continues to decline.

Changing the game: International implications of recent tariff developments

The Supreme Court ruling on International Emergency Economic Powers Act (IEEPA) tariffs provides limited relief for the rest of the world, with weighted average tariff rates modestly lower.

Bitcoin steadies as traders eye US–Iran talks

Bitcoin (BTC) price is stabilizing around $68,000 at the time of writing on Thursday after a 6.2% relief rally the previous day amid a broader downward trend.