- Oil is in consolidation mode between the 56.00 and 57.00 level.
- The level to beat for bears are seen at 56.00 and $55.00 a barrel.
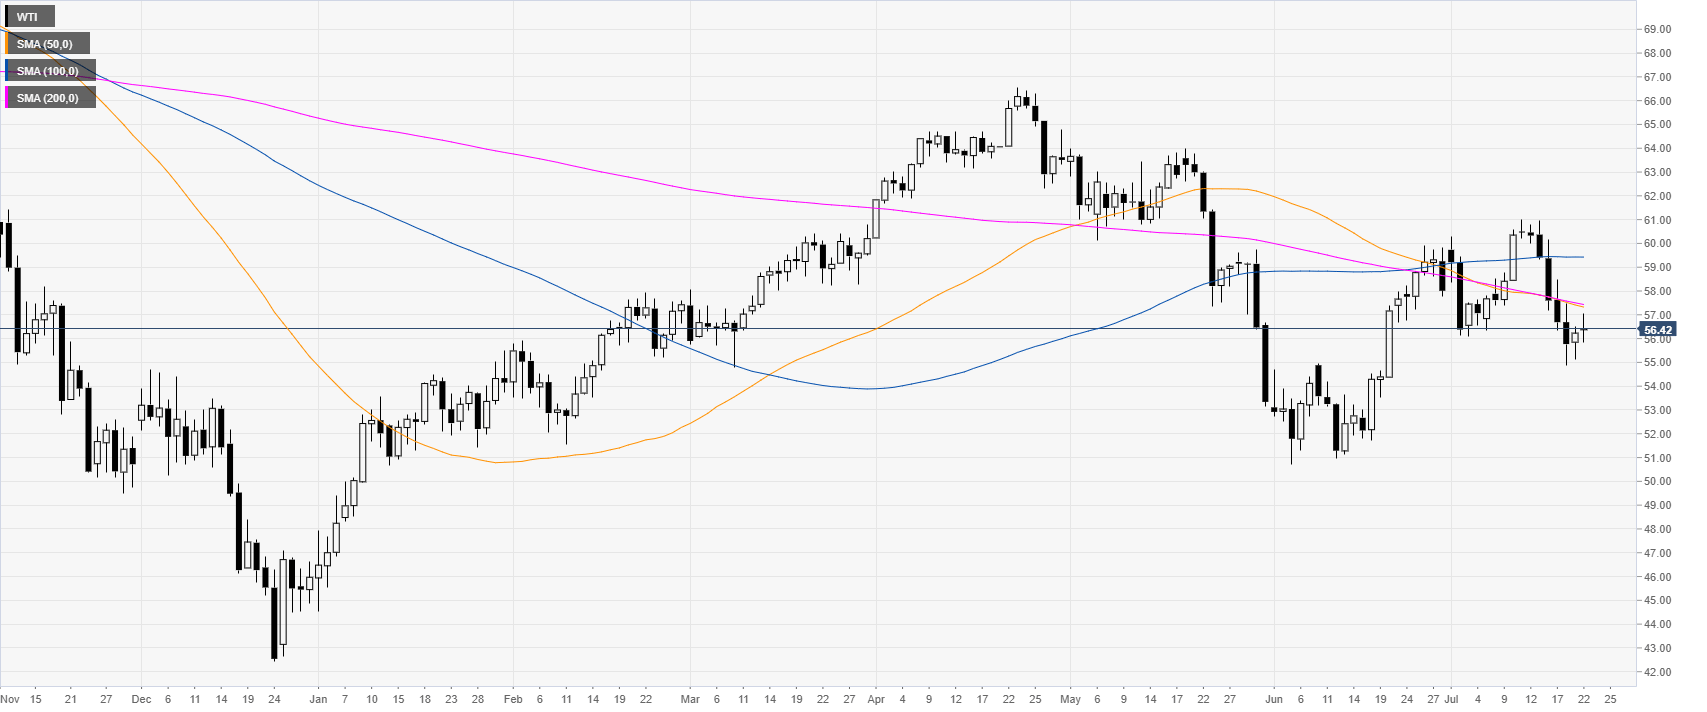
Oil daily chart
WTI (West Texas Intermediate) is consolidating the losses seen last week as it trading below $57.00 a barrel . The market is trading below its main daily simple moving averages (DSMAs).
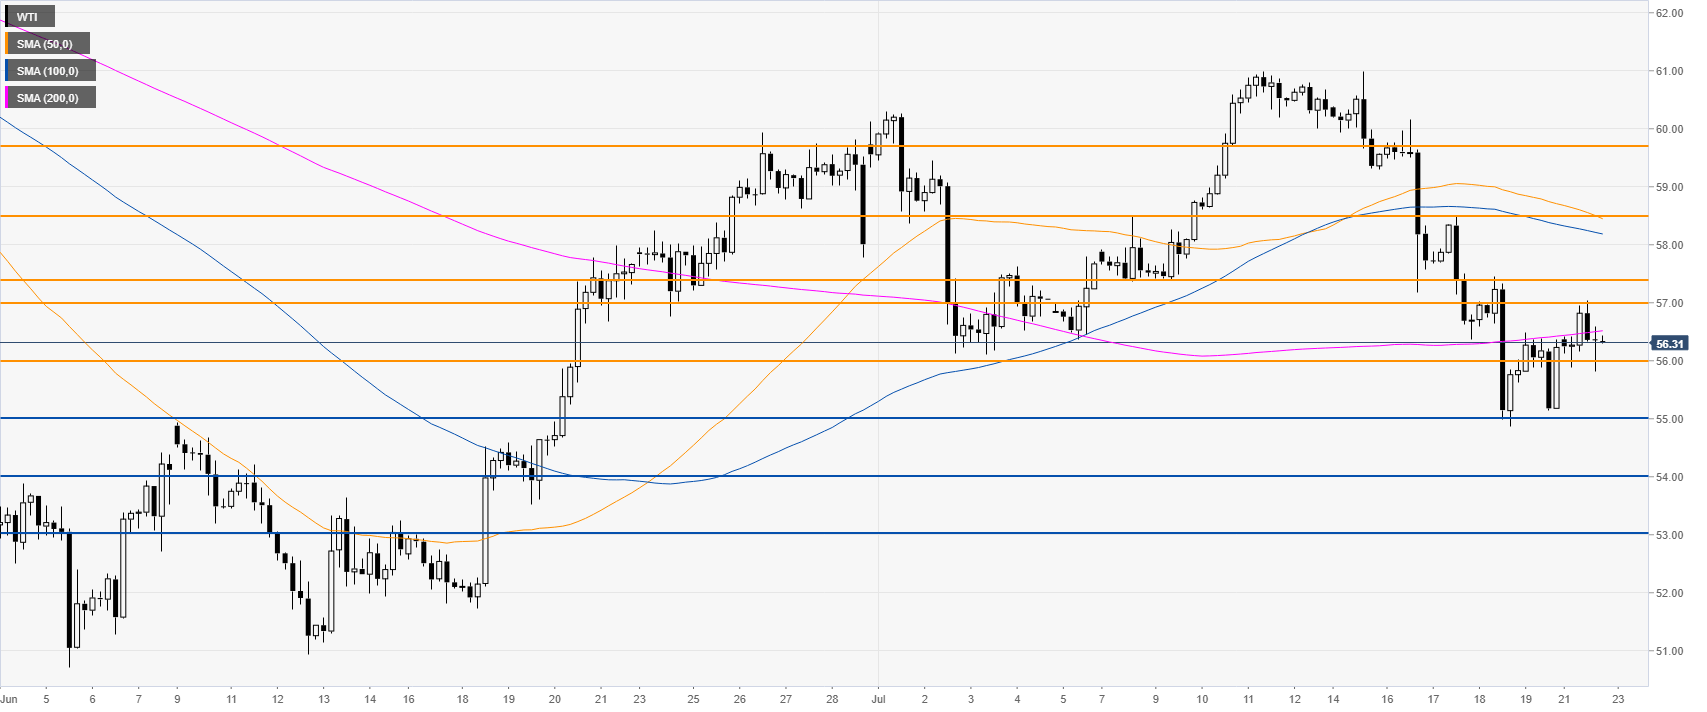
Oil 4-hour chart
The oil market is trading between the 56.00 and 57.00 level while below the 200 SMA, suggesting an overall bearish bias. A break below 56.00 can lead to 55.00 in the medium term.
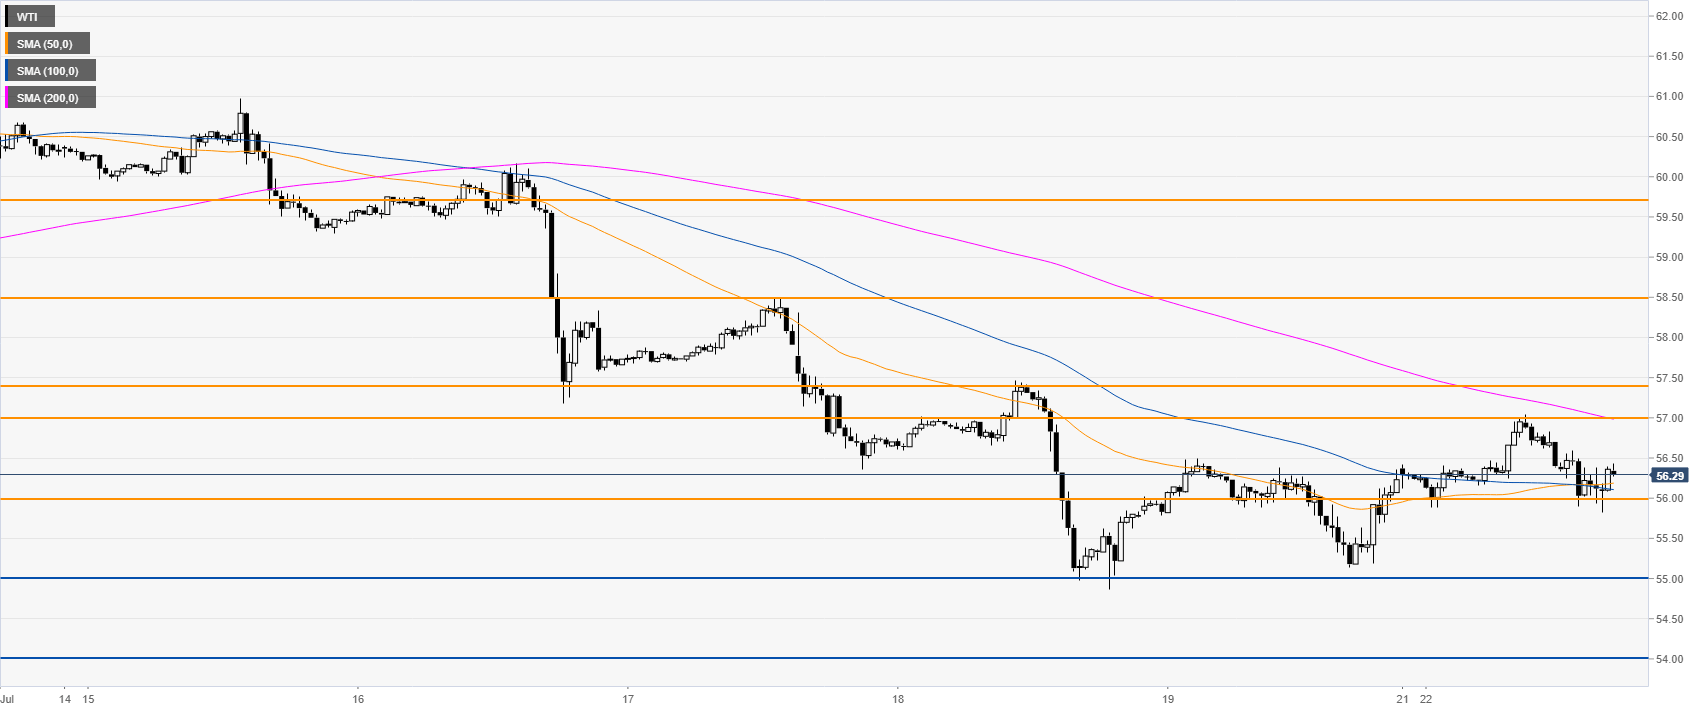
Oil 30-minute chart
Oil is trading below its trading below a descending 200 SMA suggesting bearish pressure in the near term. The market could find immediate resistances at 57.00 and 57.40
Additional key levels
Note: All information on this page is subject to change. The use of this website constitutes acceptance of our user agreement. Please read our privacy policy and legal disclaimer. Opinions expressed at FXstreet.com are those of the individual authors and do not necessarily represent the opinion of FXstreet.com or its management. Risk Disclosure: Trading foreign exchange on margin carries a high level of risk, and may not be suitable for all investors. The high degree of leverage can work against you as well as for you. Before deciding to invest in foreign exchange you should carefully consider your investment objectives, level of experience, and risk appetite. The possibility exists that you could sustain a loss of some or all of your initial investment and therefore you should not invest money that you cannot afford to lose. You should be aware of all the risks associated with foreign exchange trading, and seek advice from an independent financial advisor if you have any doubts.
Recommended content
Editors’ Picks
EUR/USD trades weak below 1.0800 amid Good Friday lull, ahead of US PCE
EUR/USD remains depressed below 1.0800, as traders lack directional impetus amid minimal volatility and thin liquidity on Good Friday. The pair keenly awaits the US PCE inflation data and Fed Chair Powell's speech for fresh hints on next week's price action.
GBP/USD holds steady above 1.2600 as markets stay calm on Good Friday
GBP/USD trades sideways above 1.2600 amid a typical Good Friday trading lull. A broadly firmer US Dollar could keep any upside attempts limited in the pair ahead of the US PCE inflation data and Fed Chair Powell's appearance.
Gold ends Q1 2024 at record highs, what’s next?
Gold is sitting at an all-time high of $2,236, lacking a trading impetus amid holiday-thinned conditions on Good Friday. Most major world markets, including the United States are closed in observance of Holy Friday, leaving volatility around Gold price highly subdued.
Ripple's move above this key level could trigger nearly 50% rally for XRP
Ripple price has overcome a critical resistance level and flipped into a support floor on the weekly time frame. This development happened while XRP tightly consolidated for roughly 250 days.
US core PCE inflation set to ease in February on month as Federal Reserve rate cut bets for June mount
The core Personal Consumption Expenditures Price Index is set to rise 0.3% MoM and 2.8% YoY in February. The revised Summary of Projections showed that policymakers upwardly revised end-2024 core PCE forecast to 2.6% from 2.4%.