Oil Technical Analysis: WTI bears challenging the daily low near $51.50 a barrel

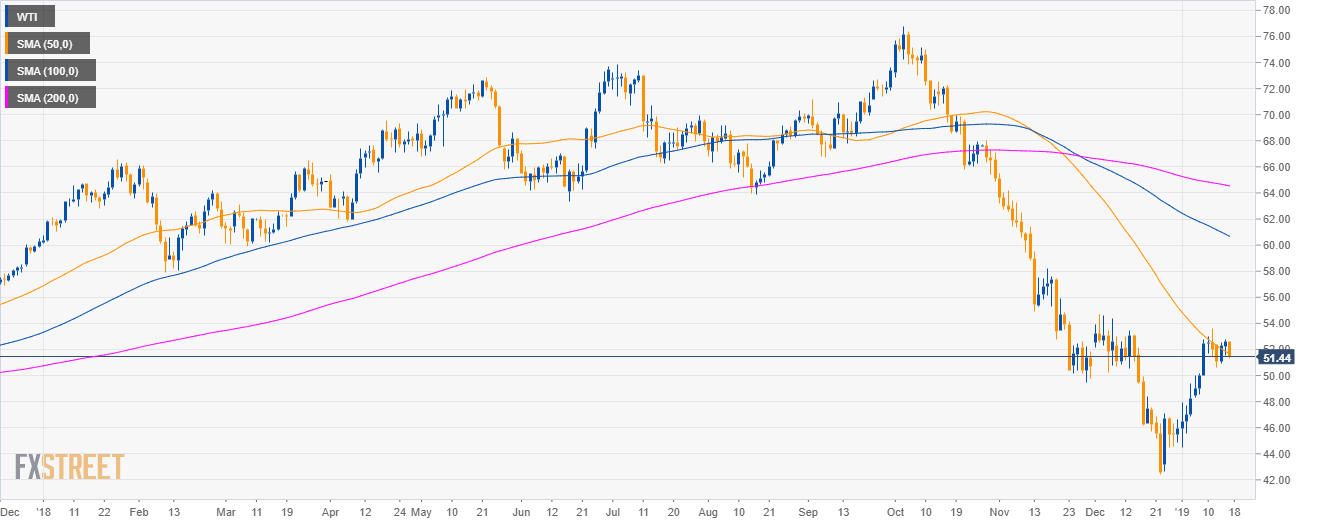
Oil daily chart
- Crude oil WTI is trading in a bear trend below the 50, 100 and 200-day simple moving averages (SMAs).
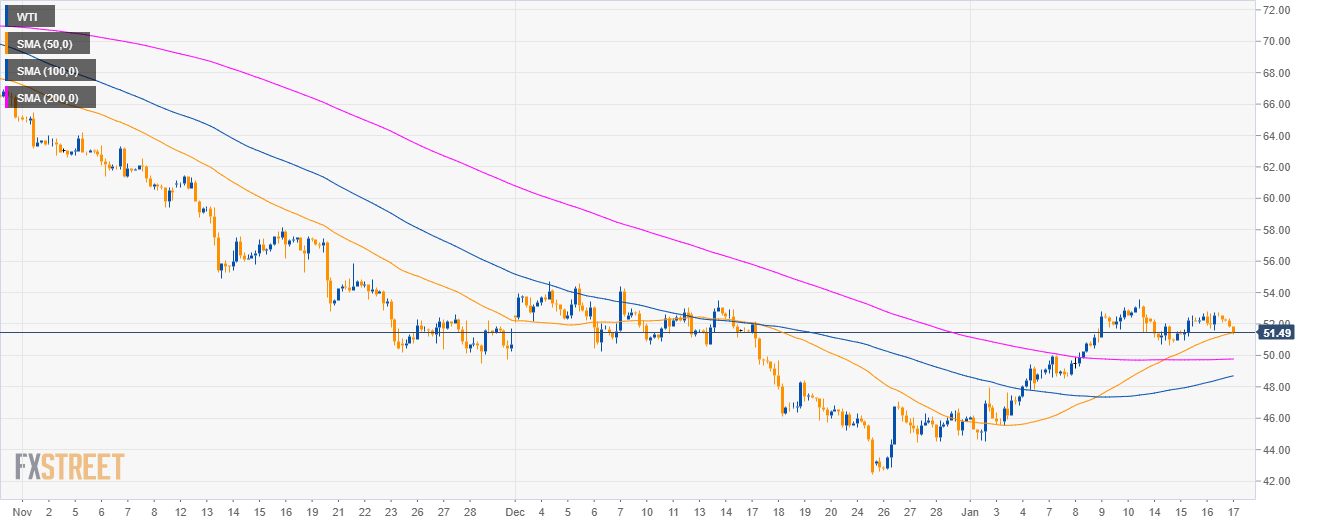
Oil 4-hour chart
- WTI is testing the 50 SMA as bears are driving the price below $52.00 a barrel.
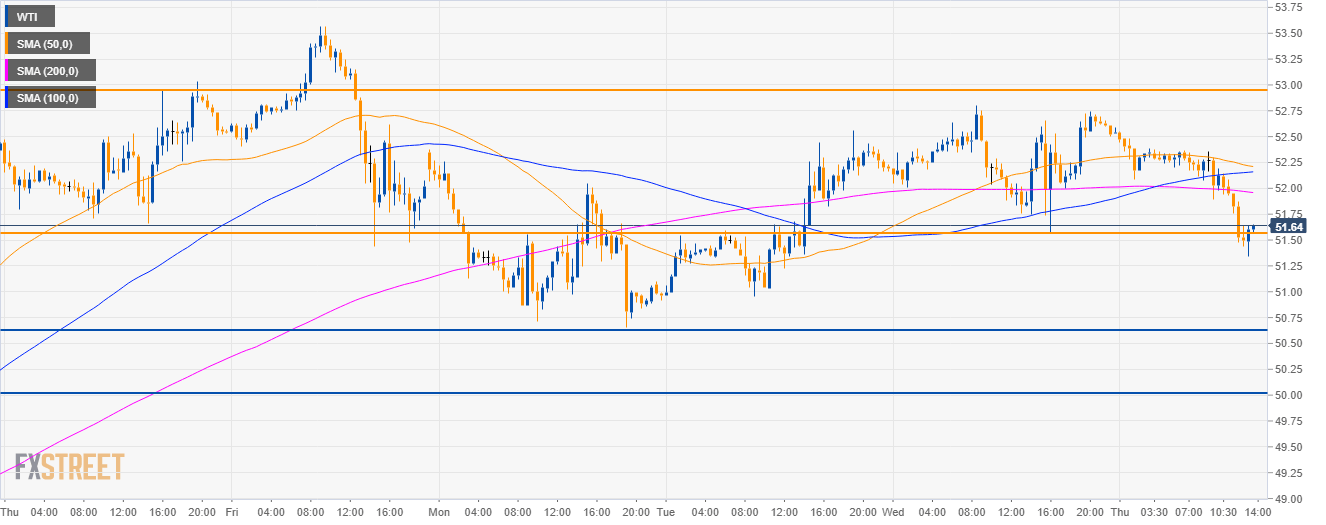
Oil 30-minute chart
- Bears are breaking below 51.55 support as the market is trading below its mains SMAs.
- A sustained move beyond that level would open the doors to 50.60 level and 50.00 the figure.
Additional key levels
WTI
Overview:
Today Last Price: 51.62
Today Daily change: -99 pips
Today Daily change %: -1.88%
Today Daily Open: 52.61
Trends:
Daily SMA20: 48.55
Daily SMA50: 51.02
Daily SMA100: 60.02
Daily SMA200: 64.3
Levels:
Previous Daily High: 52.8
Previous Daily Low: 51.56
Previous Weekly High: 53.57
Previous Weekly Low: 48.33
Previous Monthly High: 54.68
Previous Monthly Low: 42.45
Daily Fibonacci 38.2%: 52.33
Daily Fibonacci 61.8%: 52.03
Daily Pivot Point S1: 51.85
Daily Pivot Point S2: 51.08
Daily Pivot Point S3: 50.61
Daily Pivot Point R1: 53.09
Daily Pivot Point R2: 53.56
Daily Pivot Point R3: 54.33
Author

Flavio Tosti
Independent Analyst


