|

Oil Technical Analysis: Black Gold bulls at the $50.00 gate
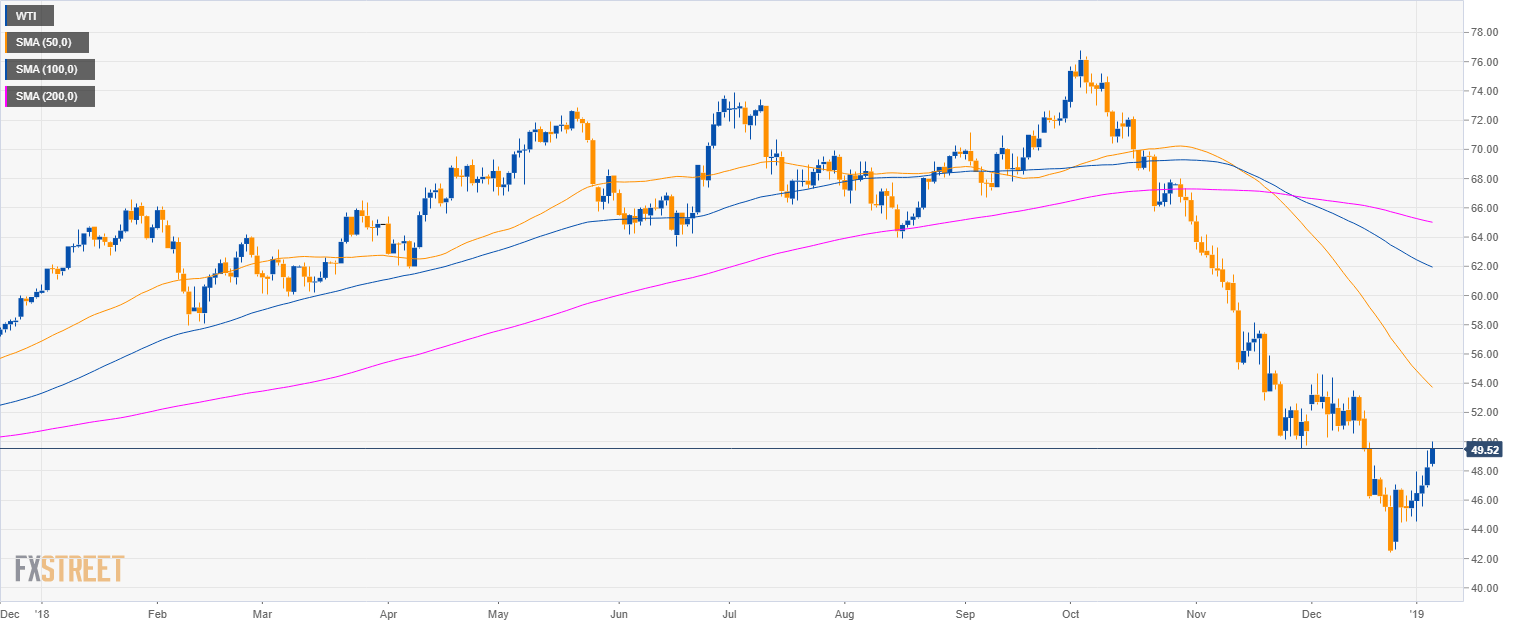
Oil daily chart

  • Crude oil WTI is trading in a bear trend below the 200-period simple moving average (SMA).
  • Bulls are attempting to create a reversal up since late December.
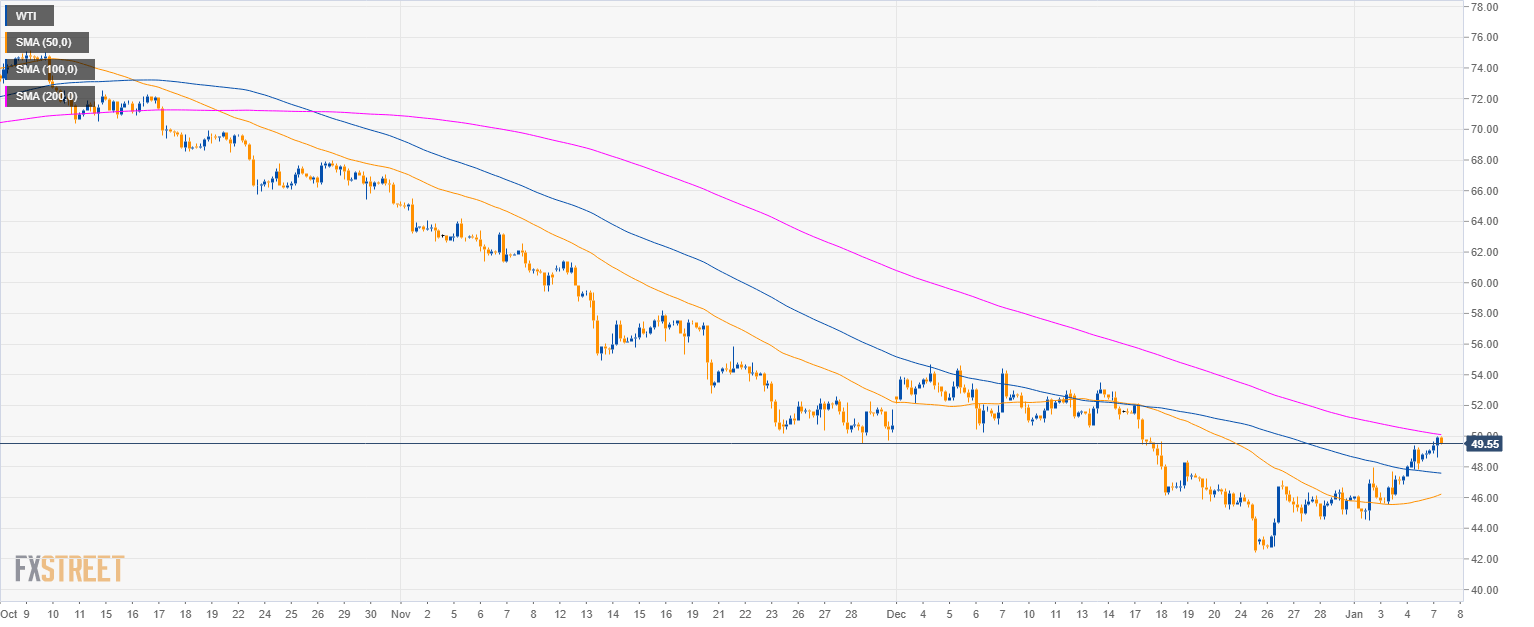
Oil 4-hour chart

  • A break above $50.00 and the 200 SMA would be significant and might lead to higher prices in coming weeks.
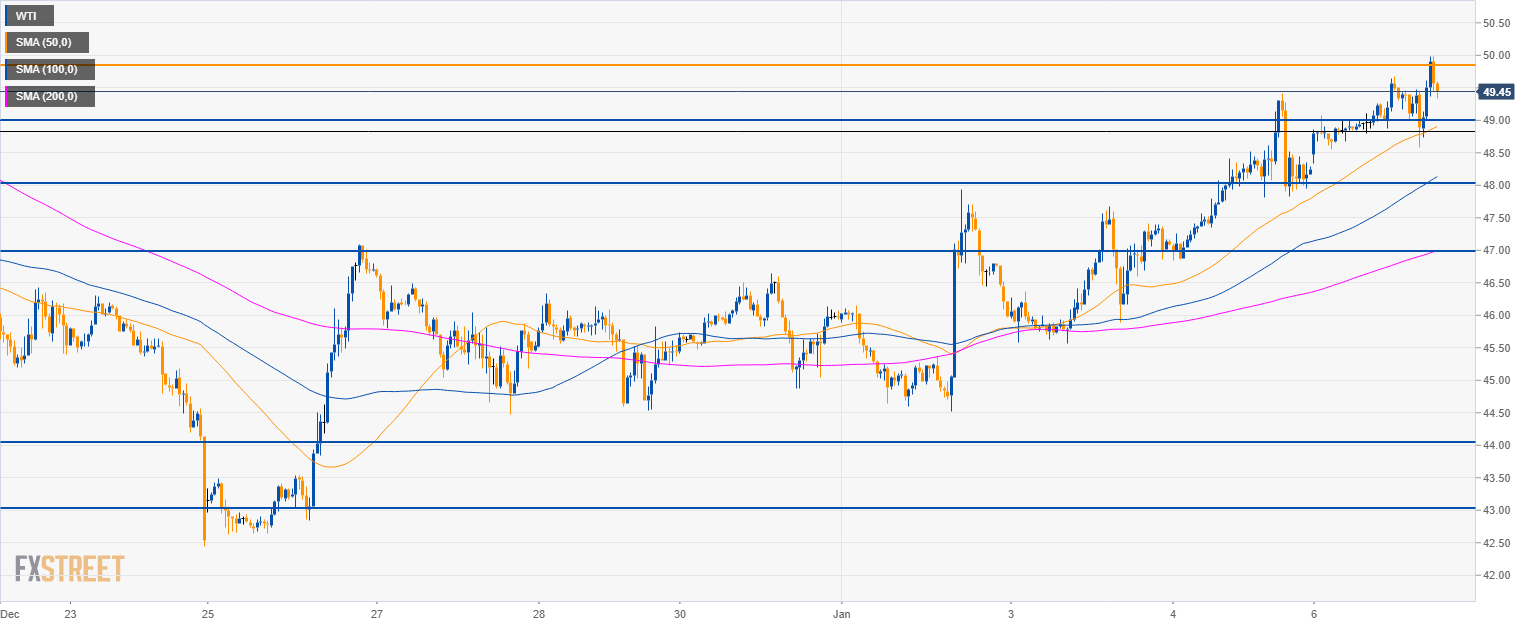
Oil 30-minute chart

  • At the time of writing the 50.00 figure seems to be a brick wall and it remains to be seen if bulls have what it takes this week to break above it.
  • To the downside, support can be seen near the 49.00, 48.00 and 47.00 figures.


Additional key levels

WTI

Overview:
    Today Last Price: 49.56
    Today Daily change: 1.3e+2 pips
    Today Daily change %: 2.74%
    Today Daily Open: 48.24
Trends:
    Previous Daily SMA20: 48.31
    Previous Daily SMA50: 52.79
    Previous Daily SMA100: 61.56
    Previous Daily SMA200: 65.19
Levels:
    Previous Daily High: 49.41
    Previous Daily Low: 46.84
    Previous Weekly High: 49.41
    Previous Weekly Low: 44.52
    Previous Monthly High: 54.68
    Previous Monthly Low: 42.45
    Previous Daily Fibonacci 38.2%: 48.43
    Previous Daily Fibonacci 61.8%: 47.82
    Previous Daily Pivot Point S1: 46.92
    Previous Daily Pivot Point S2: 45.59
    Previous Daily Pivot Point S3: 44.35
    Previous Daily Pivot Point R1: 49.49
    Previous Daily Pivot Point R2: 50.73
    Previous Daily Pivot Point R3: 52.06

Author

Flavio Tosti

Flavio Tosti

Independent Analyst


More from Flavio Tosti
Share:

Markets move fast. We move first.

Orange Juice Newsletter brings you expert driven insights - not headlines. Every day on your inbox.

By subscribing you agree to our Terms and conditions.

Editor's Picks

EUR/USD bounces toward 1.1750 as US Dollar loses strength

EUR/USD returned to the 1.1750 price zone in the American session on Friday, despite falling Wall Street, which indicates risk aversion. Trading conditions remain thin following the New Year holiday and ahead of the weekend, with the focus shifting to US employment and European data scheduled for next week.

GBP/USD nears 1.3500, holds within familiar levels

After testing 1.3400 on the last day of 2025, GBP/USD managed to stage a rebound. Nevertheless, the pair finds it difficult to gather momentum and trades with modest intraday gains at around 1.3490 as market participants remain in holiday mood.

Gold trims intraday gains, approaches $4,300

Gold retreated sharply from the $4,400  area and trades flat for the day in the $4,320 price zone. Choppy trading conditions exacerbated the intraday decline, although XAU/USD bearish case is out of the picture, considering growing expectations for a dovish Fed and persistent geopolitical tensions.

Cardano gains early New Year momentum, bulls target falling wedge breakout

Cardano kicks off the New Year on a positive note and is extending gains, trading above $0.36 at the time of writing on Friday. Improving on-chain and derivatives data point to growing bullish interest, while the technical outlook keeps an upside breakout in focus.

Economic outlook 2026-2027 in advanced countries: Solidity test

After a year marked by global economic resilience and ending on a note of optimism, 2026 looks promising and could be a year of solid economic performance. In our baseline scenario, we expect most of the supportive factors at work in 2025 to continue to play a role in 2026.

Crypto market outlook for 2026

Year 2025 was volatile, as crypto often is.  Among positive catalysts were favourable regulatory changes in the U.S., rise of Digital Asset Treasuries (DAT), adoption of AI and tokenization of Real-World-Assets (RWA).