Oil enters wild ride and falls back in red after PCE numbers
- Oil gives up earlier attempts to avoid losses and falls to session's low.
- OPEC+ will convene online to decide on production cuts, with most analysts expecting current cuts to extend into 2025.
- The US Dollar Index trades further below 105.00 to the mid 104.50-levels.

Oil prices were trying to claw back though are back to session's low with US equities rolling over. The minutes after the US Personal Consumption Expenditures (PCE) release were hopeful though with a retreating Greenback, equities higher and Oil getting some room to recover. Just an hour into the US trading session, Oil prices are back to session's low and are pushing this weekly performance in a loss.
Meanwhile, the US Dollar Index (DXY) has had a volatile week and is trading just below 105.00. The Greenback roared on Wednesday, when bond traders pushed yields higher across the board during some chunky US sovereign debt bond auctions by demanding a higher yield for the offered debt issuances. However, the move got erased on Thursday with both softer US housing data and the Gross Domestic Product data release. On Friday, the US Personal Consumption Expenditure (PCE) Price Index report pushed the Greenback to the downside with a rather disinflationary print.
At the time of writing, Crude Oil (WTI) trades at $77.35 and Brent Crude at $81.60
Oil news and market movers: All eyes on OPEC now
- OPEC+ meeting on Sunday will be an online meeting. Here are some key takeaways ahead of the meeting:
- Iran, Libya and Venezuela are exempt from production cuts because their output is constrained by external factors such as sanctions or war.
- Both Bloomberg and Reuters have reported plans to keep production cuts in place heading into 2025, according to sources close to the matter.
- United Arab Emirates and Kazakhstan are set to jack up their production in the near future with new installations and production sites set to come online.
- Traders keep pointing to the uncertain US economic outlook with an unclear monetary policy ahead, while the US housing market is showing signs of a cooldown.
- This Friday closes off with the weekly Baker Hughes Oil Rig Count data at 17:00 GMT. The previous number was a count of 497.
Oil Technical Analysis: A lost summer for Crude prices
Oil prices are showing again their sensitive side, while traders clearly see no confirmation of a pickup in demand on the horizon soon. The Fed has been clearly saying these past two weeks that chances of an initial rate cut for 2024 starts to look bleak. Not much OPEC+ can do against that, and prolonging production cuts into 2025 couldn’t be enough to order the deficit between current supply levels and the sluggish demand outlook.
First, the Simple Moving Averages (SMA) need to be regained under control. The 100-day SMA at $79.05 and the 200-day SMA at $79.56 are the first levels on the upside. Next, the 55-day Simple Moving Average (SMA) at $81.22 and the descending trendline at $81.75 are an area with a lot of resistance where any recovery rally could pause. Once broken through there, the road looks quite open to head to $87.12.
On the downside, the $76.00 marker is coming back into focus with the $75.27 level playing a crucial role if traders still want to have an option to head back to $80.00. Should that $75.27 pivotal level snap, expect to see a risk-full nosedive move that could sprint all the way down to $68, below $70.00.
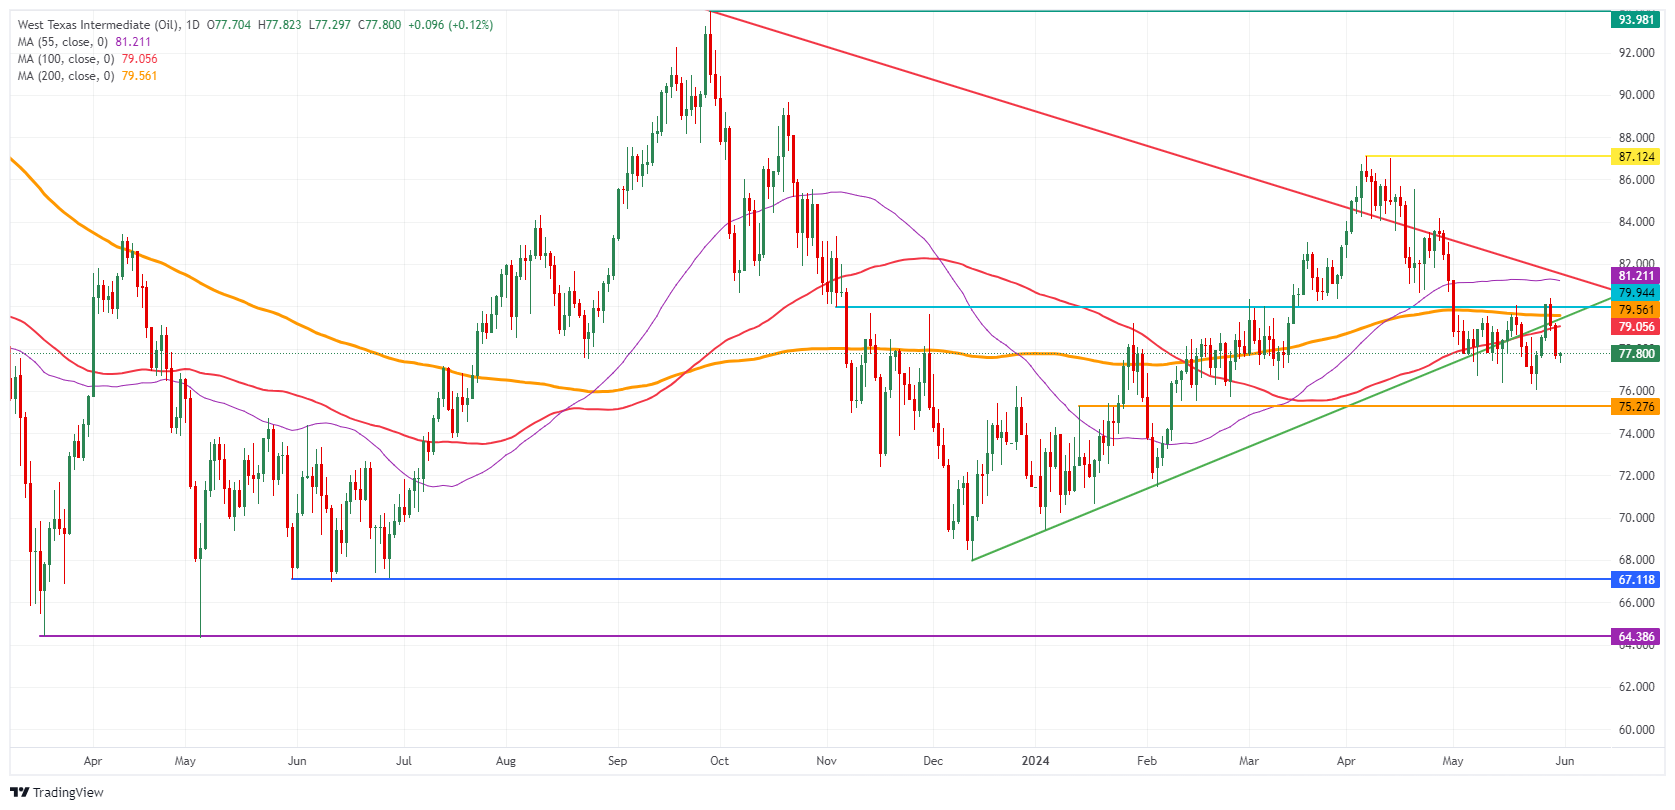
US WTI Crude Oil: Daily Chart
WTI Oil FAQs
WTI Oil is a type of Crude Oil sold on international markets. The WTI stands for West Texas Intermediate, one of three major types including Brent and Dubai Crude. WTI is also referred to as “light” and “sweet” because of its relatively low gravity and sulfur content respectively. It is considered a high quality Oil that is easily refined. It is sourced in the United States and distributed via the Cushing hub, which is considered “The Pipeline Crossroads of the World”. It is a benchmark for the Oil market and WTI price is frequently quoted in the media.
Like all assets, supply and demand are the key drivers of WTI Oil price. As such, global growth can be a driver of increased demand and vice versa for weak global growth. Political instability, wars, and sanctions can disrupt supply and impact prices. The decisions of OPEC, a group of major Oil-producing countries, is another key driver of price. The value of the US Dollar influences the price of WTI Crude Oil, since Oil is predominantly traded in US Dollars, thus a weaker US Dollar can make Oil more affordable and vice versa.
The weekly Oil inventory reports published by the American Petroleum Institute (API) and the Energy Information Agency (EIA) impact the price of WTI Oil. Changes in inventories reflect fluctuating supply and demand. If the data shows a drop in inventories it can indicate increased demand, pushing up Oil price. Higher inventories can reflect increased supply, pushing down prices. API’s report is published every Tuesday and EIA’s the day after. Their results are usually similar, falling within 1% of each other 75% of the time. The EIA data is considered more reliable, since it is a government agency.
OPEC (Organization of the Petroleum Exporting Countries) is a group of 13 Oil-producing nations who collectively decide production quotas for member countries at twice-yearly meetings. Their decisions often impact WTI Oil prices. When OPEC decides to lower quotas, it can tighten supply, pushing up Oil prices. When OPEC increases production, it has the opposite effect. OPEC+ refers to an expanded group that includes ten extra non-OPEC members, the most notable of which is Russia.
Author

Filip Lagaart
FXStreet
Filip Lagaart is a former sales/trader with over 15 years of financial markets expertise under its belt.


