|

NZDUSD Price Analysis: Steadies above 0.6100 inside bullish triangle

  • NZDUSD remains sidelined after bouncing off a one-week-old horizontal support.
  • Sluggish oscillators, bullish chart pattern keeps buyers hopeful but 0.6160 holds the key for the bull’s conviction.
  • 200-HMA, fortnight-old ascending trend line restricts immediate downside.

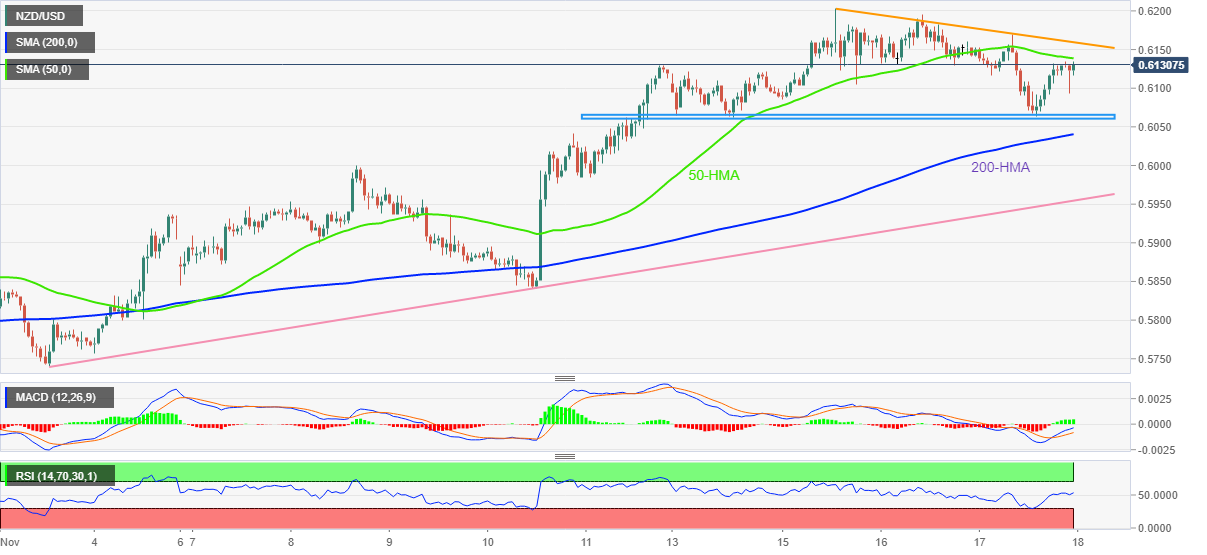
NZDUSD seesaws around 0.6130, challenging a two-day downtrend, as traders struggle for fresh clues inside a one-week-old descending triangle bullish formation during early Friday.

In doing so, the Kiwi pair makes rounds to the 50-HMA amid the inactive performance of the Relative Strength Index (RSI) placed at 14, as well as the Moving Average Convergence and Divergence (MACD).

With this, the Kiwi pair is likely to remain sidelined during the five-week uptrend, despite the latest pullback.

However, a downside break of the stated triangle’s support area, near 0.6060, won’t hesitate to recall the NZDUSD bears.

Following that, the 200-HMA and a two-week-long ascending support line, respectively around 0.6040 and 0.5955, could challenge the quote’s further downside.

Meanwhile, the 50-HMA level surrounding 0.6140 restricts the immediate upside of the NZDUSD pair.

Even so, the stated triangle’s top line near 0.6160 appears crucial to convince the pair buyers in retaking control. Also acting as an upside filter is the monthly high near 0.6205.

Overall, NZDUSD buyers are likely to keep the reins despite the latest pullback in prices.

NZDUSD: Hourly chart

Trend: Limited recovery expected

Additional important levels

Overview
Today last price0.6131
Today Daily Change-0.0022
Today Daily Change %-0.36%
Today daily open0.6153
 
Trends
Daily SMA200.5888
Daily SMA500.5822
Daily SMA1000.6019
Daily SMA2000.6318
 
Levels
Previous Daily High0.6195
Previous Daily Low0.6129
Previous Weekly High0.613
Previous Weekly Low0.5841
Previous Monthly High0.5874
Previous Monthly Low0.5512
Daily Fibonacci 38.2%0.6154
Daily Fibonacci 61.8%0.617
Daily Pivot Point S10.6123
Daily Pivot Point S20.6093
Daily Pivot Point S30.6056
Daily Pivot Point R10.6189
Daily Pivot Point R20.6225
Daily Pivot Point R30.6255

Author

Anil Panchal

Anil Panchal

FXStreet

Anil Panchal has nearly 15 years of experience in tracking financial markets. With a keen interest in macroeconomics, Anil aptly tracks global news/updates and stays well-informed about the global financial moves and their implications.

More from Anil Panchal
Share:

Markets move fast. We move first.

Orange Juice Newsletter brings you expert driven insights - not headlines. Every day on your inbox.

By subscribing you agree to our Terms and conditions.

Editor's Picks

EUR/USD moves sideways below 1.1800 on Christmas Eve

EUR/USD struggles to find direction and trades in a narrow channel below 1.1800 after posting gains for two consecutive days. Bond and stock markets in the US will open at the usual time and close early on Christmas Eve, allowing the trading action to remain subdued. 

GBP/USD keeps range around 1.3500 amid quiet markets

GBP/USD keeps its range trade intact at around 1.3500 on Wednesday. The Pound Sterling holds the upper hand over the US Dollar amid pre-Christmas light trading as traders move to the sidelines heading into the holiday season. 

Gold retreats from record highs, trades below $4,500

Gold retreats after setting a new record-high above $4,520 earlier in the day and trades in a tight range below $4,500 as trading volumes thin out ahead of the Christmas break. The US Dollar selling bias remains unabated on the back of dovish Fed expectations, which continues to act as a tailwind for the bullion amid persistent geopolitical risks.

Bitcoin slips below $87,000 as ETF outflows intensify, whale participation declines

Bitcoin price continues to trade around $86,770 on Wednesday, after failing to break above the $90,000 resistance. US-listed spot ETFs record an outflow of $188.64 million on Tuesday, marking the fourth consecutive day of withdrawals.

Economic outlook 2026-2027 in advanced countries: Solidity test

After a year marked by global economic resilience and ending on a note of optimism, 2026 looks promising and could be a year of solid economic performance. In our baseline scenario, we expect most of the supportive factors at work in 2025 to continue to play a role in 2026.

Avalanche struggles near $12 as Grayscale files updated form for ETF

Avalanche trades close to $12 by press time on Wednesday, extending the nearly 2% drop from the previous day. Grayscale filed an updated form to convert its Avalanche-focused Trust into an ETF with the US Securities and Exchange Commission.