NZD/USD technical analysis: 0.6686 holds the key to 200-day SMA
- Break of 61.8% Fibonacci retracement portrays the NZD/USD pair’s strength.
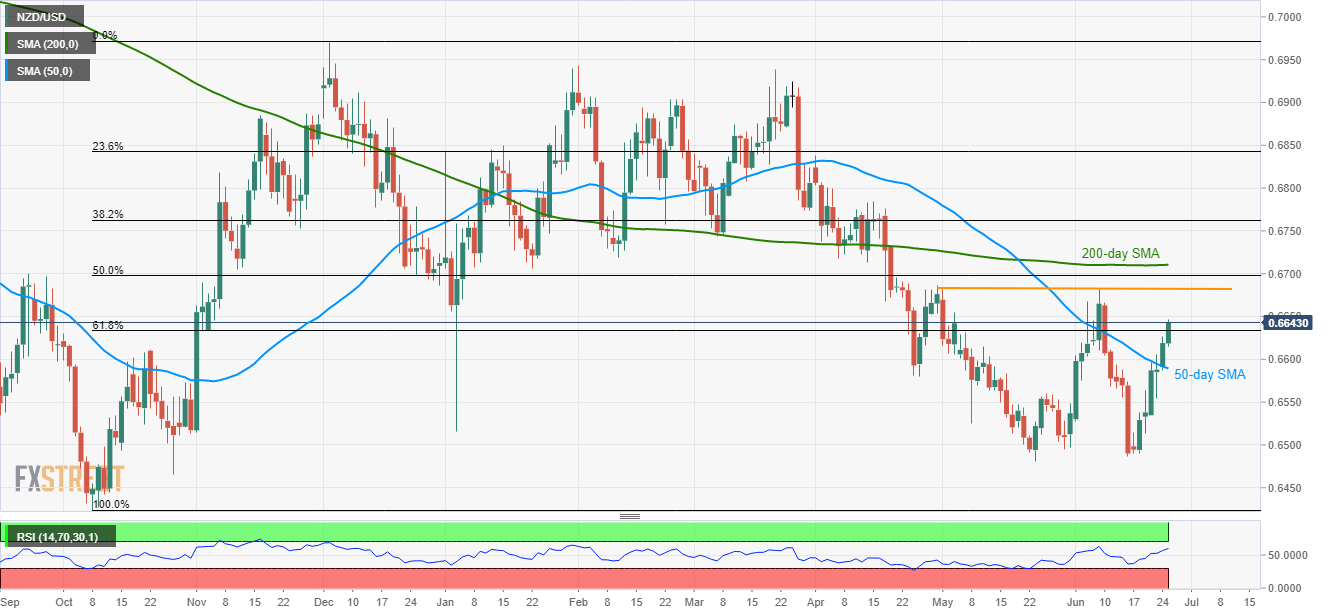
- Late-April top near 0.6686 continues to hold the gate for the rise to 200-day SMA.
- 50-day SMA acts as immediate support.

A successful break of 61.8% Fibonacci retracement propels the NZD/USD pair to 15-day high as it trades near 0.6644 during early Tuesday.
While a sustained break of important Fibonacci retracement levels of late-2018 upside favors the buyers, the pair still needs to cross the current month high around 0.6682 and hold the strength beyond April-end tops around 0.6686 in order to aim for 200-day simple moving average (200-day SMA) level of 0.6710.
If 14-day relative strength index (RSI) refraining from raising any barriers for the pair’s upside past-0.6710, mid-April high at 0.6783 could be on the bulls’ watchlist.
Should prices fail to hold recent breakout, 50-day SMA level around 0.6590 acts as immediate support.
In a case where the quote keeps declining beneath 0.6590, May 27 high near 0.6560 and current month low near 0.6487 could gain market attention.
NZD/USD daily chart
Trend: Bullish
Author

Anil Panchal
FXStreet
Anil Panchal has nearly 15 years of experience in tracking financial markets. With a keen interest in macroeconomics, Anil aptly tracks global news/updates and stays well-informed about the global financial moves and their implications.


