NZD/USD steadies as soft CPI data fuels RBNZ cut bets, USD weakens on trade risk
- NZD/USD steadies as traders digest inflation data from New Zealand and escalating EU-US trade tensions.
- The Kiwi benefits from US Dollar weakness despite softer than expected CPI print.
- NZD/USD defends support as long lower wick signals intraday bullish rebound.

The New Zealand Dollar (NZD) is battling the US Dollar (USD) on Monday as traders weigh EU–US trade tensions against mixed domestic inflation data from New Zealand that could prompt RBNZ rate cuts.
Statistics New Zealand released the Consumer Price Index (CPI) data for the second quarter on Sunday, which provided a mixed picture. While both the QoQ and YoY readings were both below estimates, inflation in the second quarter printed at 0.5% versus a 0.6% estimate, falling 0.9% previously. Meanwhile, the annual Q2 figure came in at 2.7%, below economist forecasts of 2.8% but above the previous 2.5% print.
Although the RBNZ is keeping a close eye on price pressure, it is also aware that the economy is slowing. Comments from RBNZ policymakers have reinforced that the central bank is closely monitoring the slowdown and is open to rate cuts if disinflation persists and growth continues to underperform.
At the May 28 Monetary Policy Press Conference, Acting RBNZ Governor Christian Hawkesby stated, “We're seeing softening momentum in business investment, household spending, and the labour market. We’re in a data-dependent phase, and further easing is not off the table.”
Despite the softer CPI, NZD/USD found support as the broader US Dollar retreated, driven by escalating trade tensions between the US and the European Union. US President Donald Trump’s renewed threats of tariffs on imports from the EU, including prospects of higher levies on pharmaceuticals and a 15%-20% baseline tariff even if a deal is reached has made traders increasingly weary.
As the EU prepares potential retaliatory measures in the event that a deal is not reached before the August 1 deadline, rising transatlantic trade tensions are providing support for the Kiwi.
Together, these factors have prevented NZD/USD from extending losses, even as the RBNZ leans more dovish. Investors now look ahead to New Zealand’s Trade Balance data scheduled for 22:45 GMT on Monday, which may offer further insight into export demand and the broader health of the economy.
NZD/USD technical analysis: Kiwi defends support as the battle between bulls and bears persists
NZD/USD is attempting to stabilize above near-term support, with the current daily candle resembling a potential hanging man pattern, a signal that often hints at fading bullish momentum.
The pair slipped to an intraday low of 0.5938 earlier in the session but has since rebounded toward the 0.5970 region, reflecting underlying buying interest. The long lower shadow highlights that bulls stepped in to defend support, yet the pair remains capped below key resistance at the 50% Fibonacci retracement of the May–July rally at 0.5984, as well as the 50-day Simple Moving Average (SMA) at 0.5996.
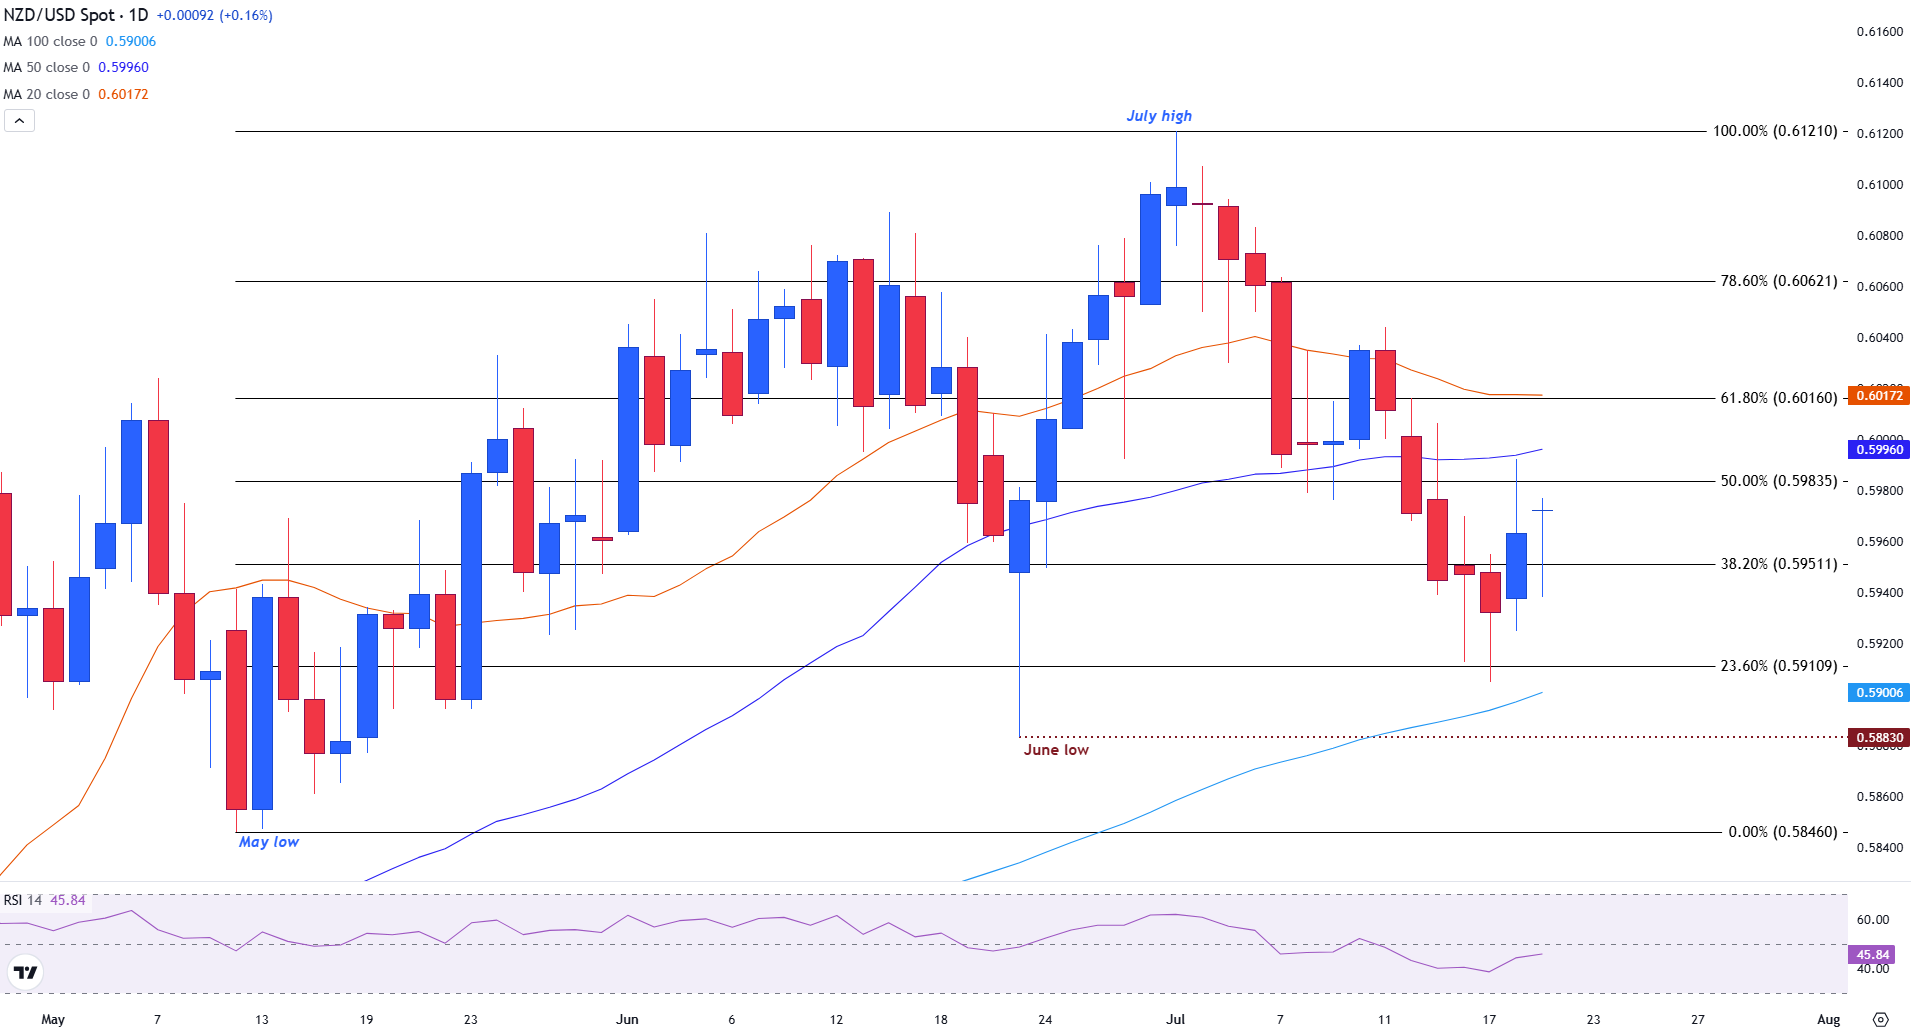
NZD/USD daily chart
The Relative Strength Index (RSI) is holding just below 46, indicating that momentum remains slightly bearish despite the bounce. If the current candle closes near present levels, it may mark a loss of upward momentum — though confirmation would require Tuesday’s candle to follow through with a lower close. A decisive break above the 0.6000 psychological barrier would shift near-term bias back in favor of the bulls, while a drop below 0.5951 could open the door for a deeper pullback toward the 100-day SMA at 0.5900.
New Zealand Dollar FAQs
The New Zealand Dollar (NZD), also known as the Kiwi, is a well-known traded currency among investors. Its value is broadly determined by the health of the New Zealand economy and the country’s central bank policy. Still, there are some unique particularities that also can make NZD move. The performance of the Chinese economy tends to move the Kiwi because China is New Zealand’s biggest trading partner. Bad news for the Chinese economy likely means less New Zealand exports to the country, hitting the economy and thus its currency. Another factor moving NZD is dairy prices as the dairy industry is New Zealand’s main export. High dairy prices boost export income, contributing positively to the economy and thus to the NZD.
The Reserve Bank of New Zealand (RBNZ) aims to achieve and maintain an inflation rate between 1% and 3% over the medium term, with a focus to keep it near the 2% mid-point. To this end, the bank sets an appropriate level of interest rates. When inflation is too high, the RBNZ will increase interest rates to cool the economy, but the move will also make bond yields higher, increasing investors’ appeal to invest in the country and thus boosting NZD. On the contrary, lower interest rates tend to weaken NZD. The so-called rate differential, or how rates in New Zealand are or are expected to be compared to the ones set by the US Federal Reserve, can also play a key role in moving the NZD/USD pair.
Macroeconomic data releases in New Zealand are key to assess the state of the economy and can impact the New Zealand Dollar’s (NZD) valuation. A strong economy, based on high economic growth, low unemployment and high confidence is good for NZD. High economic growth attracts foreign investment and may encourage the Reserve Bank of New Zealand to increase interest rates, if this economic strength comes together with elevated inflation. Conversely, if economic data is weak, NZD is likely to depreciate.
The New Zealand Dollar (NZD) tends to strengthen during risk-on periods, or when investors perceive that broader market risks are low and are optimistic about growth. This tends to lead to a more favorable outlook for commodities and so-called ‘commodity currencies’ such as the Kiwi. Conversely, NZD tends to weaken at times of market turbulence or economic uncertainty as investors tend to sell higher-risk assets and flee to the more-stable safe havens.
Author

Tammy Da Costa, CFTe®
FXStreet
Tammy is an economist and market analyst with a deep passion for financial markets, particularly commodities and geopolitics.


