|

NZD/USD sets a new low for 2023 of 0.5772 before seeing a soft rebound

  • The NZD/USD caught some much-needed lift on Thursday after setting a new eleven-month low.
  • NZ's Roy Morgan Consumer Confidence for October improved slightly.
  • Markets are turning towards Friday's US PCE Index release to close out the trading week.

The NZD/USD set a fresh low of 0.5772 for 2023, the pair's lowest bid since November of last year. After chalking in a new yearly low, the Kiwi (NZD) caught a much-needed rebound and heads into the Friday Asia market session trading near 0.5820.

US Gross Domestic Product (GDP) figures broadly beat market estimates, printing at 4.9% for the 3rd quarter compared to the previous reading of 2.1%, soundly thumping the market estimates of 4.2%.

Forex Today: Dollar stays cool despite hot US economy

Despite the bumper US data read, the US Dollar (USD) gave up some ground against the NZD after etching in a new high against the Antipodean.

New Zealand Consumer Confidence for October increased slightly, helping to give some minor intraday lift to the Kiwi, with the Roy Morgan sentiment measure coming in at 88.1 compared to September's 86.4.

The broader market now turns towards Friday's US Personal Consumption Expenditure (PCE) Price Index reading for September. The PCE Index, as the Federal Reserve's favored measure of inflation, will be closely watched by traders hoping for signs that the Fed will be pushed into a rate-cut cycle sooner rather than later.

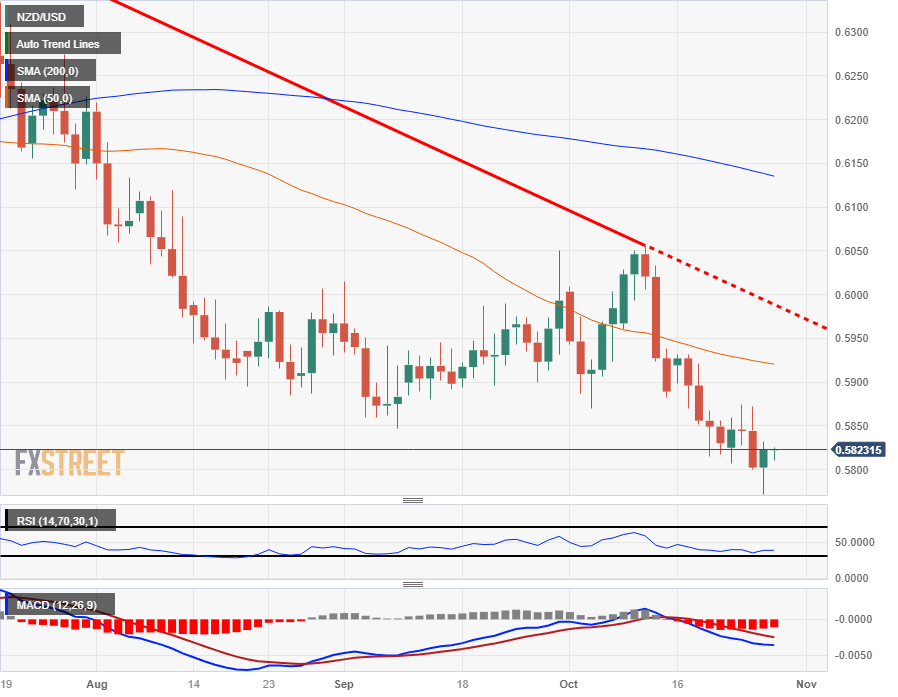
NZD/USD Technical Outlook

With the NZD/USD trading into eleven-month lows, the way below is primed for the Kiwi to face off against swing lows from back in November of 2022, near 0.5740.

Technical resistance is mounting on the NZD/USD with the 50-day Simple Moving Average (SMA) dropping into 0.5925 and the last significant swing high sitting near 0.6050.

On the bullish side, the Relative Strength Index (RSI) is testing close to the oversold barrier, indicating there could be buying opportunities from extreme lows, though indicator traders may want to wait for a fast-line bullish crossover on the Moving Average Convergence-Divergence (MCAD) oscillator.

NZD/USD Daily Chart

NZD/USD Technical Levels

NZD/USD

Overview
Today last price0.5822
Today Daily Change0.0020
Today Daily Change %0.34
Today daily open0.5802
 
Trends
Daily SMA200.5921
Daily SMA500.5924
Daily SMA1000.6041
Daily SMA2000.6141
 
Levels
Previous Daily High0.5872
Previous Daily Low0.58
Previous Weekly High0.5931
Previous Weekly Low0.5815
Previous Monthly High0.605
Previous Monthly Low0.5847
Daily Fibonacci 38.2%0.5828
Daily Fibonacci 61.8%0.5844
Daily Pivot Point S10.5777
Daily Pivot Point S20.5753
Daily Pivot Point S30.5705
Daily Pivot Point R10.5849
Daily Pivot Point R20.5897
Daily Pivot Point R30.5921

Author

Joshua Gibson

Joshua joins the FXStreet team as an Economics and Finance double major from Vancouver Island University with twelve years' experience as an independent trader focusing on technical analysis.

More from Joshua Gibson
Share:

Editor's Picks

EUR/USD rises to 1.1800 neighborhood amid renewed USD selling and trade uncertainties

The EUR/USD pair regains positive traction during the Asian session on Wednesday and jumps to the 1.1800 neighborhood in the last hour, reversing the previous day's modest losses. The intraday move up is sponsored by the emergence of fresh US Dollar, which continues to be weighed down by persistent trade-related uncertainties.

GBP/USD remains stronger above 1.3500 following Trump’s State of the Union

GBP/USD remains in the positive territory for the fourth successive session, trading around 1.3510 during the Asian hours on Wednesday. The pair appreciates as the US Dollar remains subdued following US President Donald Trump’s first State of the Union address of his second administration before a joint session of Congress.

Gold re-attempts $5,200 amid tariffs and geopolitical woes

Gold buyers are back in the game early Wednesday after seeing a correction from monthly highs on Tuesday. The US Dollar slips after Trump’s SOTU fails to impress and as AI-driven worries ease. Dovish Fed bets also weigh.  Gold looks north so long as the key 61.8% Fibo resistance at $5,142 holds on the daily chart.

Bitcoin, Ethereum and Ripple post cautious recovery amid downside risks

Bitcoin, Ethereum, and Ripple are posting a cautious recovery on Wednesday following a market correction earlier this week.  BTC is approaching a key breakdown level, while ETH and XRP are rebounding from crucial support levels.

The Citrini report: How a debatable AI narrative can shake Wall Street

That AI-related headline alone was enough to rattle investors.US stocks slid sharply on Monday after a widely circulated Citrini Research memo outlined a hypothetical “2028 Global Intelligence Crisis”, warning that rapid AI adoption could push US unemployment into double digits as early as by mid-2028.

XRP pressured by weak ETF flows and declining retail interest

Ripple (XRP) is edging lower, trading above its intraday low of $1.32 at the time of writing on Tuesday. The decline from its weekly opening of $1.39 reflects heightened volatility in the broader cryptocurrency market, accentuated by tariff-triggered uncertainty.