NZD/USD risks further downside as Kiwi tests critical support at 0.6050
- NZD/USD consolidates within a symmetrical triangle on the 4-hour chart, reflecting short-term indecision.
- A rising wedge pattern on the daily chart signals a potential bearish breakout below 0.6038.
- Kiwi tests critical psychological support at 0.6050.

The New Zealand Dollar (NZD) is weakening against the US Dollar (USD) on Friday as market participants weigh near-term resistance against a weakening bullish structure.
At the time of writing, NZD/USD is trading around 0.6050, pulling back from the 0.6120 resistance level after failing to maintain recent highs.
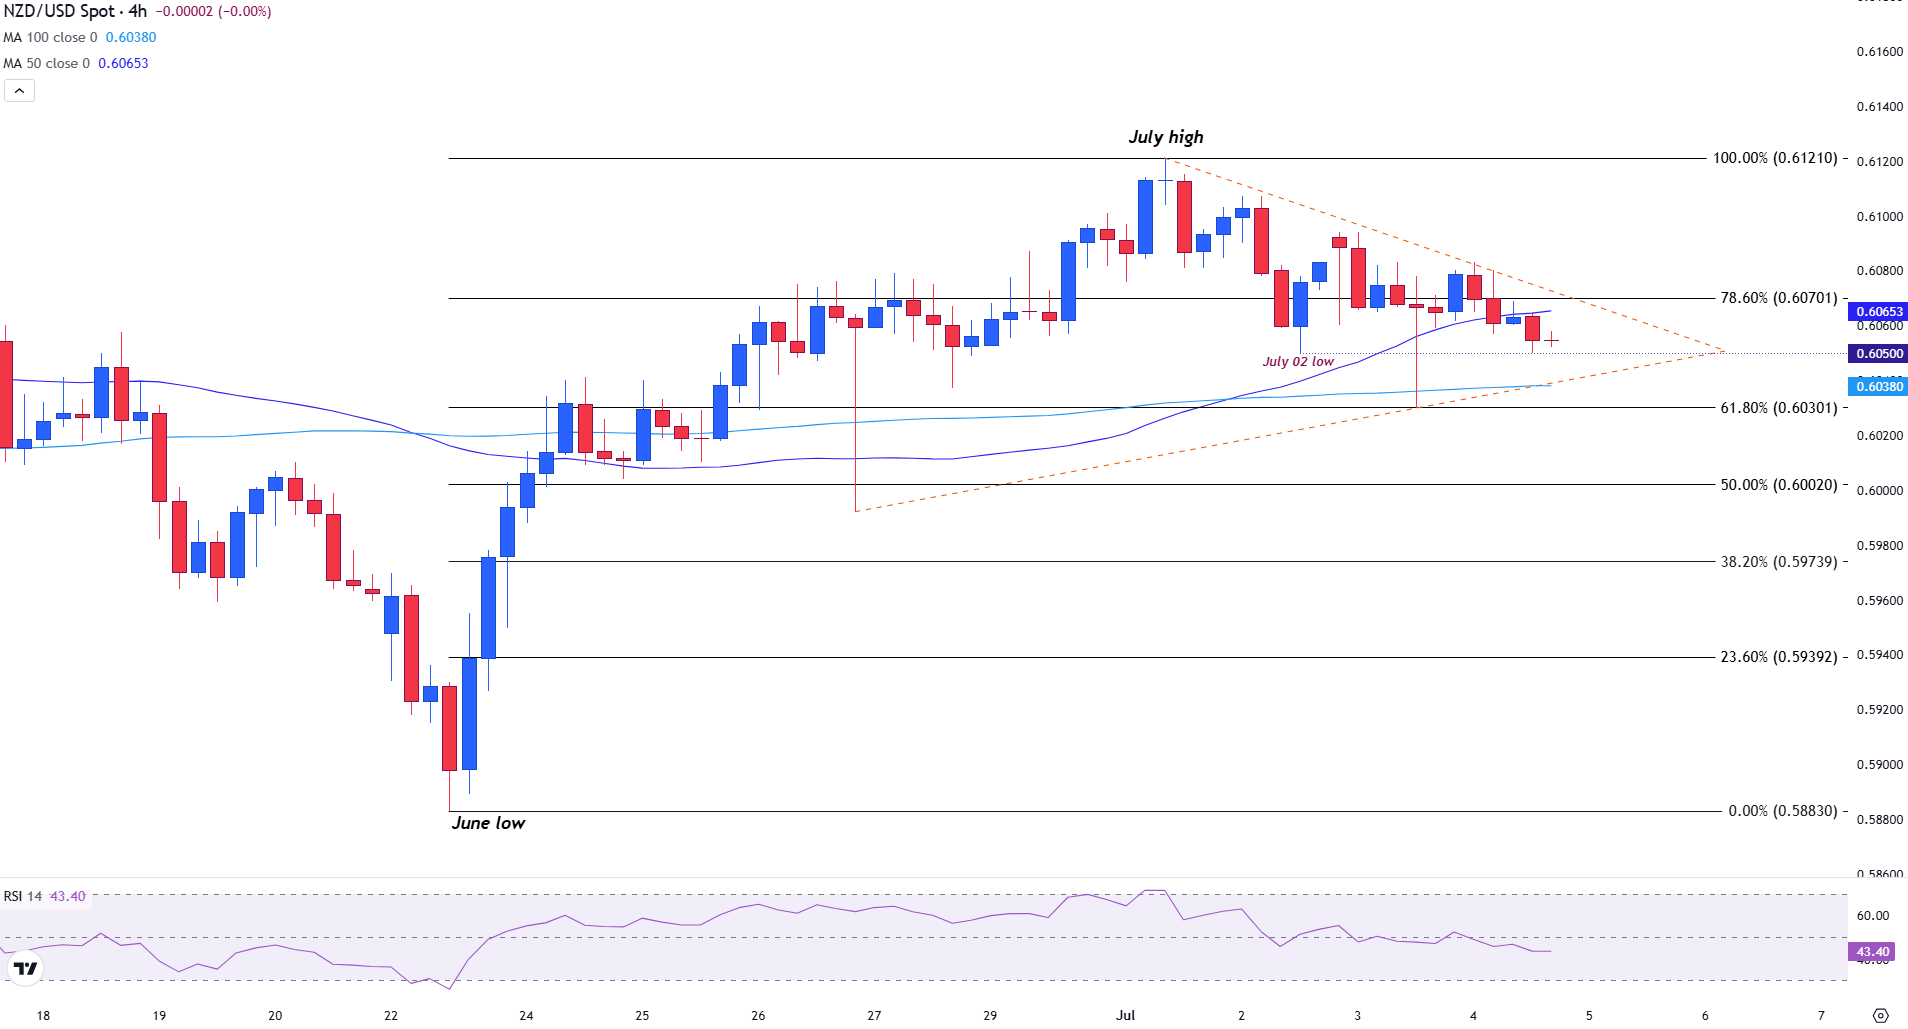
The NZD/USD 4-hour chart displays a symmetrical triangle pattern formed by a series of lower highs and higher lows, with price action converging into a tightening range.
This pattern typically indicates market indecision, with neither bulls nor bears in full control, and often precedes a breakout.
In this case, the triangle is forming just below the 78.6% Fibonacci retracement level of the June low to July high move. This level aligns with the 0.6070 psychological resistance.
Dynamic support rests at the 100-period SMA of 0.6038.
NZD/USD 4-hour chart
On the daily chart, NZD/USD continues to trade within a rising wedge formation, characterized by converging upward-sloping trendlines. This pattern typically signals a potential bearish reversal, especially when formed near key resistance zones.
NZD/USD daily chart
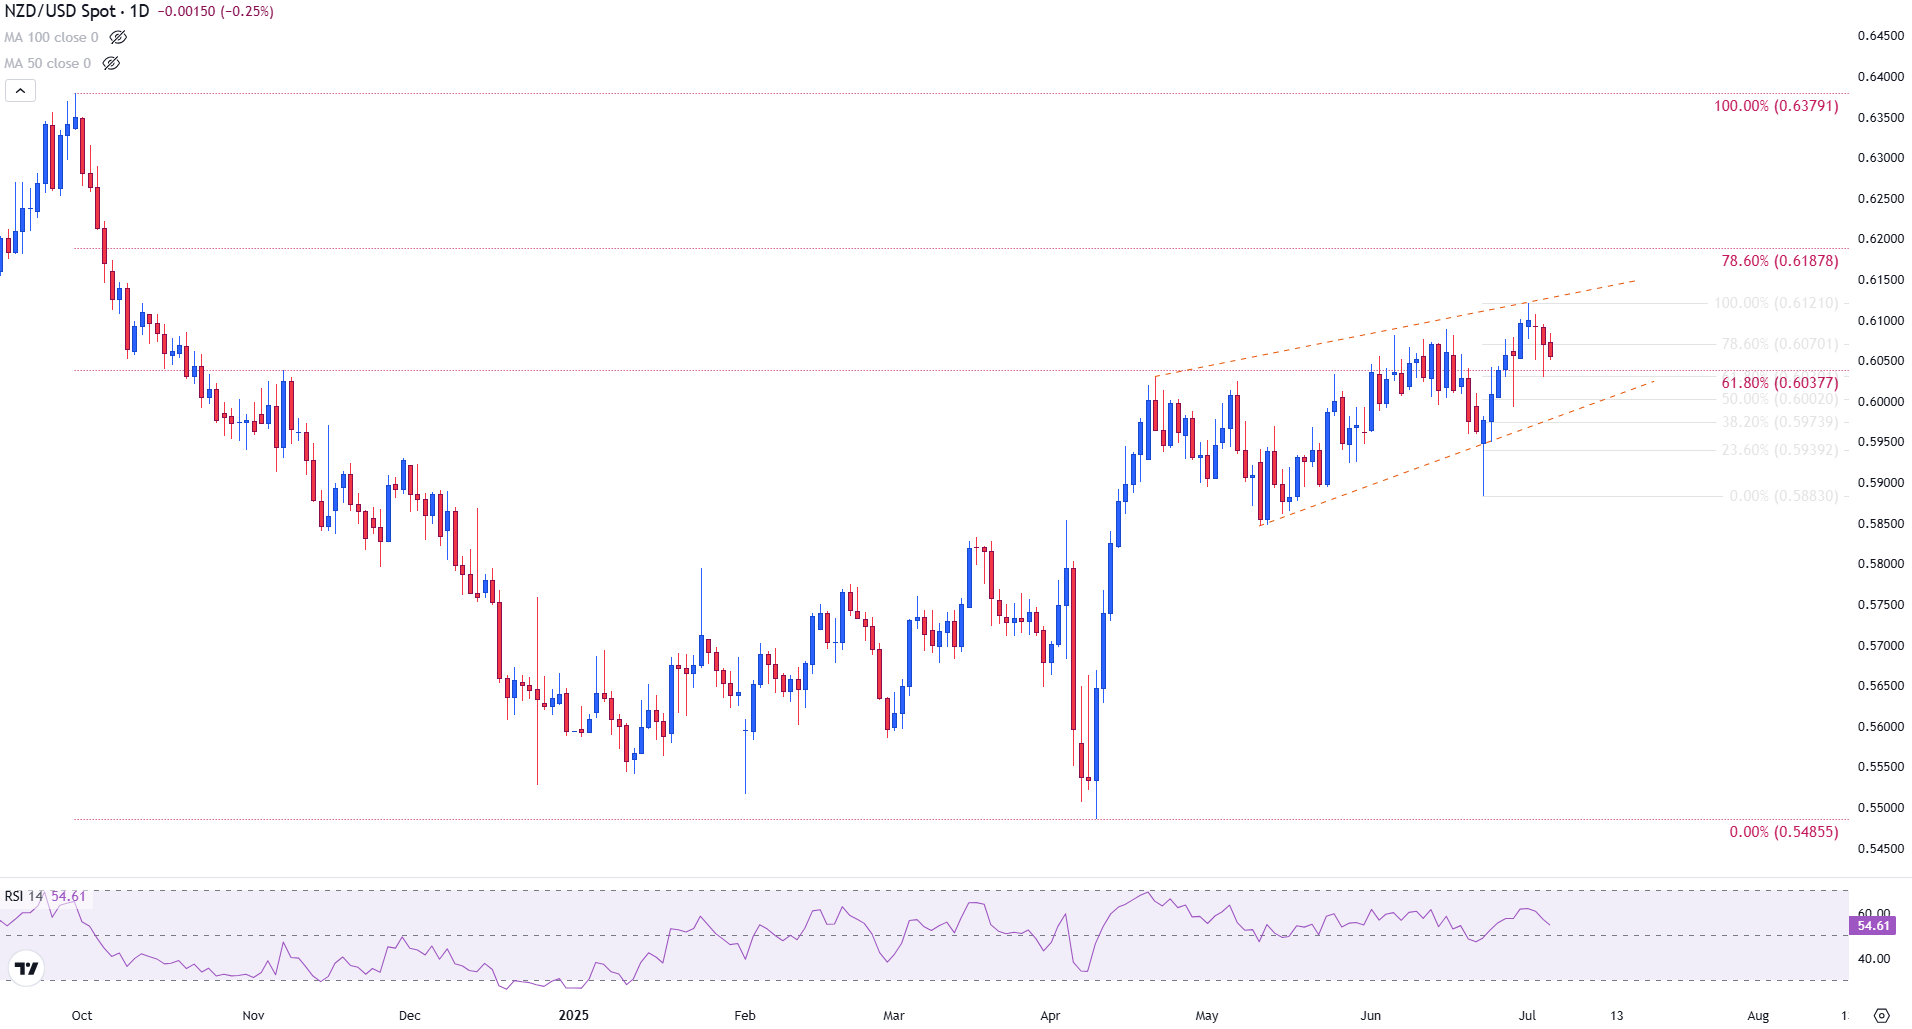
The Relative Strength Index (RSI) is currently at 54, indicating mild bullish momentum but without conviction. This aligns with the 4-hour chart, where a symmetrical triangle is forming just beneath the same resistance zone, suggesting near-term consolidation within a broader, potentially weakening uptrend.
A downside break below wedge support on the daily chart, particularly beneath the 61.8% Fibonacci retracement level of the September-April decline near 0.6038, would add weight to bearish risks. In contrast, a breakout above the July high of 0.6120 could invalidate the pattern and signal a continuation toward 0.6379 (the 78.6% Fibonacci level of the longer-term move).
New Zealand Dollar FAQs
The New Zealand Dollar (NZD), also known as the Kiwi, is a well-known traded currency among investors. Its value is broadly determined by the health of the New Zealand economy and the country’s central bank policy. Still, there are some unique particularities that also can make NZD move. The performance of the Chinese economy tends to move the Kiwi because China is New Zealand’s biggest trading partner. Bad news for the Chinese economy likely means less New Zealand exports to the country, hitting the economy and thus its currency. Another factor moving NZD is dairy prices as the dairy industry is New Zealand’s main export. High dairy prices boost export income, contributing positively to the economy and thus to the NZD.
The Reserve Bank of New Zealand (RBNZ) aims to achieve and maintain an inflation rate between 1% and 3% over the medium term, with a focus to keep it near the 2% mid-point. To this end, the bank sets an appropriate level of interest rates. When inflation is too high, the RBNZ will increase interest rates to cool the economy, but the move will also make bond yields higher, increasing investors’ appeal to invest in the country and thus boosting NZD. On the contrary, lower interest rates tend to weaken NZD. The so-called rate differential, or how rates in New Zealand are or are expected to be compared to the ones set by the US Federal Reserve, can also play a key role in moving the NZD/USD pair.
Macroeconomic data releases in New Zealand are key to assess the state of the economy and can impact the New Zealand Dollar’s (NZD) valuation. A strong economy, based on high economic growth, low unemployment and high confidence is good for NZD. High economic growth attracts foreign investment and may encourage the Reserve Bank of New Zealand to increase interest rates, if this economic strength comes together with elevated inflation. Conversely, if economic data is weak, NZD is likely to depreciate.
The New Zealand Dollar (NZD) tends to strengthen during risk-on periods, or when investors perceive that broader market risks are low and are optimistic about growth. This tends to lead to a more favorable outlook for commodities and so-called ‘commodity currencies’ such as the Kiwi. Conversely, NZD tends to weaken at times of market turbulence or economic uncertainty as investors tend to sell higher-risk assets and flee to the more-stable safe havens.
Author

Tammy Da Costa, CFTe®
FXStreet
Tammy is an economist and market analyst with a deep passion for financial markets, particularly commodities and geopolitics.


