NZD/USD rises back above 0.6200 on a weaker US Dollar
- NZD/USD bounces to 0.6207 from a low of 0.6149, buoyed by a weaker US dollar after a disappointing jobs report.
- US adds 209K jobs, below expectations, but the unemployment rate falls to 3.6%. Wage growth remains strong at 4.4% YoY.
- Traders confident in Fed’s rate hike at July meeting, with odds now at 92.4%.
- Reserve Bank of New Zealand is expected to maintain rates in the upcoming meeting after recent hikes.

NZD/USD climbs back above 0.6200 on Friday as the US Dollar (USD) weakened due to a softer-than-foreseen jobs report in the United States (US), which was expected to deliver solid figures following Thursday’s solid labor market data. The NZD/USD is trading at 0.6207 after hitting a daily low of 0.6149.
NZD/USD strengthens due to weaker US Dollar after disappointing US NFP report
The US Bureau of Labor Statistics (BLS) revealed the economy added just 209K jobs to the economy, as shown by the June Nonfarm Payrolls report. In addition, the data showed the Unemployment Rate dropped from 3.7% in May to 3.6^% in June. Of note, Average Hourly Earnings (AHE) rose from 4.2% to 4.4% YoY, a sign that wage growth remains resilient.
NZD/USD traded volatile after the data, seesawed at around the 0.6159-0.6202 range before stabilizing at current exchange rates, as the greenback edged lower, weighed by US Treasury bond yields drop.
The US 10-year Treasury note yields 4.02%, falls one and a half basis points, while the US Dollar Index (DXY), a gauge of the buck’s value against a basket of six currencies, dives to 102.438, losses 0.66% after staying above the 103.000 during the past four days.
Although the US Nonfarm Payrolls report was soft, traders remain certain the US Federal Reserve (Fed) will increase rates by 25 bps at the July 25-26 meeting, as shown by the CME FedWatch Tool. Odds are at 92.4%, higher than last week’s 86.8%. Nevertheless, they seem not convinced the Fed will hike twice, as the Fed’s dot-plot portrayed.
On the New Zealand (NZ) front, its economic docket for the next week will feature the Reserve Bank of New Zealand (RBNZ) monetary policy meeting. The RBNZ is expected to hold rates unchanged, after 525 bps increases, since late 2021.
NZD/USD Price Analysis: Technical outlook
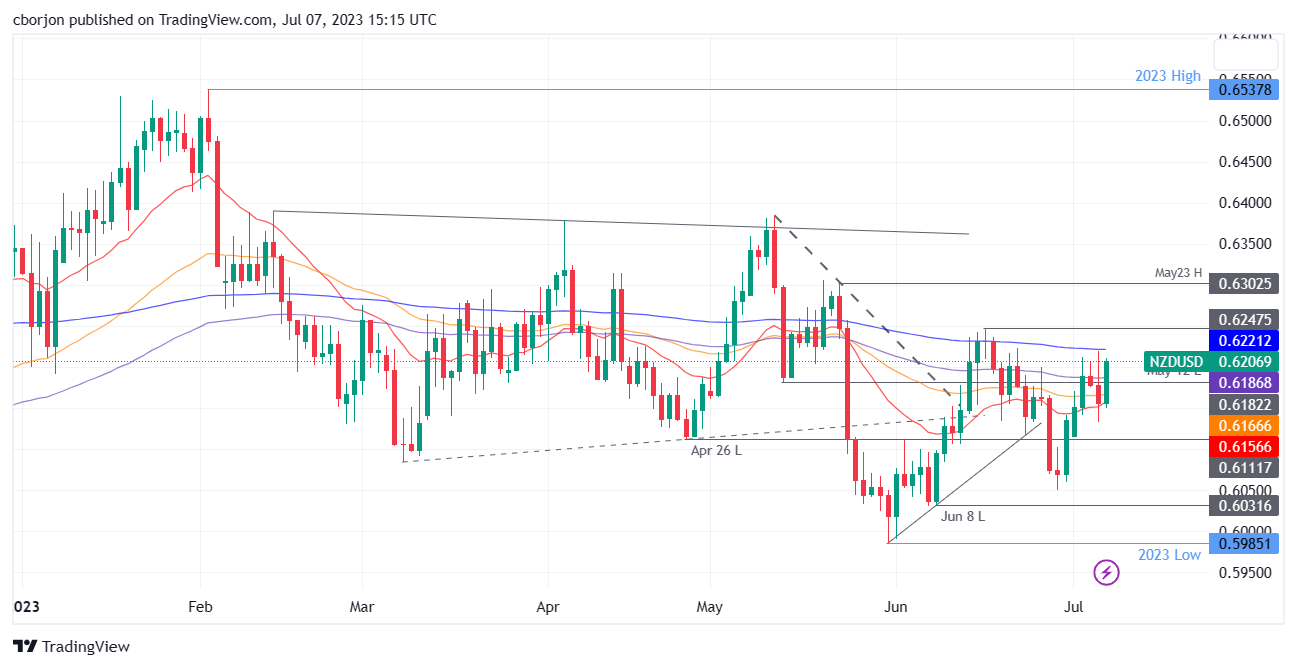
The NZD/USD is neutral-biased, capped on the upside by the 200-day Exponential Moving Average (EMA) at 0.6221. Once the level is surpassed, the pair could rally toward June 16 high at 0.6247, followed by May 23 swing high at 0.6302. On the flip side, the NZD/USD would initially dip to the 100-day EMA at 0.6186 if it struggles to cling above 0.6200. Next, support levels lie at the 50-day EMA at 0.6166, followed by the 20-day EMA at 0.6156.
Author

Christian Borjon Valencia
FXStreet
Markets analyst, news editor, and trading instructor with over 14 years of experience across FX, commodities, US equity indices, and global macro markets.
















