NZD/USD retreats as Fed signals caution and Kiwi struggles on mixed jobs data
- NZD/USD consolidates near 0.6000 after touching a six-month high.
- Fed leaves rates unchanged but highlights rising inflation and unemployment risks.
- Technical indicators present a mixed outlook, with key support at 0.5920 and resistance at 0.5950.

The NZD/USD pair is pulling back from a six-month high near 0.6025 reached earlier on Wednesday, trading around 0.6000 as investors react to the Federal Reserve’s (Fed) cautious policy tone and mixed economic data from New Zealand. The Fed kept its policy rate unchanged at 4.25%-4.50% in line with market expectations but acknowledged rising inflation and unemployment risks, adding a layer of uncertainty to the market.
The Fed’s policy statement reaffirmed its data-dependent approach, highlighting that inflation remains “somewhat elevated” and that risks to both unemployment and inflation have increased. This cautious tone, combined with ongoing balance sheet reduction, has supported the US Dollar (USD), putting pressure on the New Zealand Dollar (NZD). The US Dollar Index (DXY) remains steady near 99.50, reflecting cautious market sentiment ahead of Fed Chairman Jerome Powell’s press conference.
Meanwhile, New Zealand’s Q1 labor market data added to the Kiwi’s struggles. The unemployment rate remained unchanged at 5.1%, surprising markets that expected a slight increase to 5.3%. However, the Labor Cost Index grew at a slower pace than expected, reinforcing expectations for further easing by the Reserve Bank of New Zealand (RBNZ). The RBNZ is likely to maintain a dovish stance, with markets pricing in additional rate cuts over the coming months.
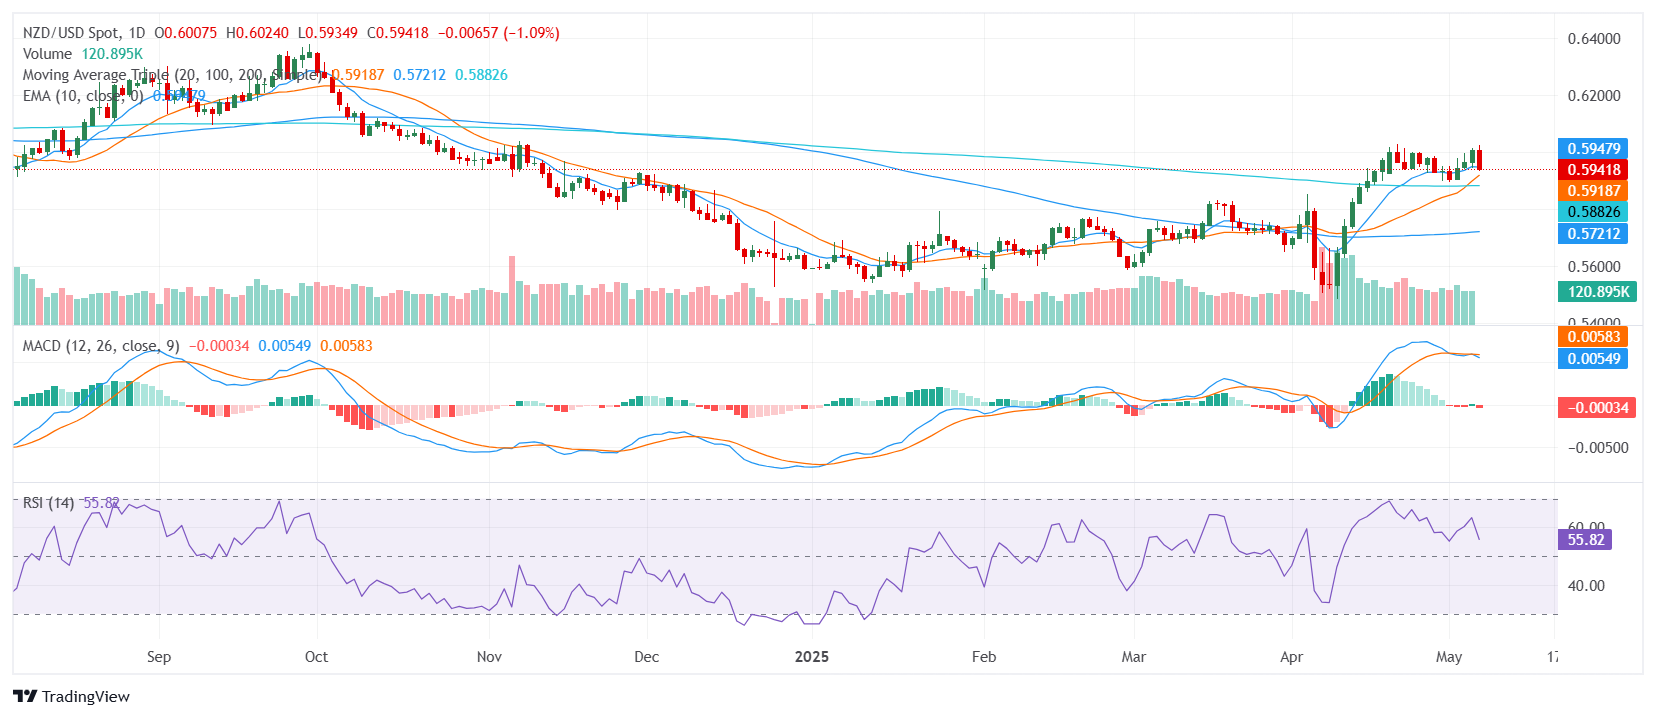
Technical Analysis
Technically, NZD/USD faces initial resistance at 0.5943, followed by 0.5948 and 0.5952. On the downside, support is seen at 0.5930, 0.5915, and 0.5886. The RSI is neutral at 55.28, while the MACD shows a bearish divergence, suggesting a potential correction. However, longer-term moving averages, including the 100-day SMA (0.5728) and 200-day SMA (0.5886), signal a more bullish outlook, keeping the broader trend intact.
In summary, the NZD/USD outlook remains mixed as the pair consolidates recent gains, with market sentiment likely to hinge on Fed guidance and further clarity on New Zealand’s economic path.
Daily Chart
Author

Patricio Martín
FXStreet
Patricio is an economist from Argentina passionate about global finance and understanding the daily movements of the markets.


