|

NZD/USD rallies back into the 0.6000 level with US PPI, Retail Sales around the corner

  • The NZD/USD has bounded back into the top end after broader markets went risk-on.
  • Tuesday saw safe havens go broadly lower as investors stepped out post-US CPI.
  • Up Next: US PPI, Retail Sales slated for Wednesday.

The NZD/USD has ripped higher after gaining almost 2.6% from Tuesday's lows. The Kiwi (NZD) saw its single best trading day against the US Dollar (USD) since July of this year as broad-market risk appetite roared back following a US Consumer Price Index (CPI) inflation reading that came in below expectations.

US inflation appears to be easing at a faster rate than market participants anticipated ahead of the US CPI print, and the decline in headline inflation sent the Greenback broadly lower across the board. 

US CPI inflation softens to 3.2% vs. 3.3% forecast

Month-over-month headline US CPI in October printed at a flat 0.0%, coming in below the forecast 0.1% and dipping even further from the previous month's print of 0.4%.

With inflation measures falling past forecasts, investors are seeing hopes of the Federal Reserve (Fed) getting pushed off their "higher for longer" hawkish perch and will see an accelerated timeline for beginning the next rate cut cycle.

Forex Today: US inflation slows, Dollar tumbles

Next up on the economic calendar data docket will be US Producer Price Index (PPI) and Retail Sales numbers.

Core US PPI for the year into October is expected to print flat at 2.7%, in-line with September's annualized reading, while US MoM Retail Sales are forecast to see a sharp turnaround from September's 0.7% growth. Median market forecasts see October's monthly Retail Sales number printing at -0.3%.

NZD/USD Technical Outlook

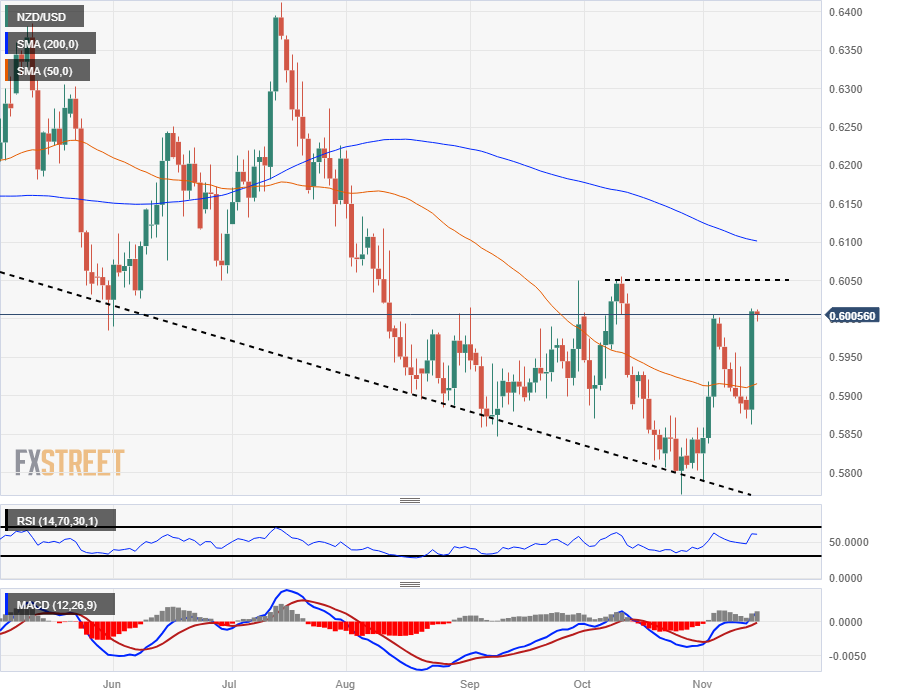
Despite the Kiwi's firm bounce to reclaim the 0.6000 major handle on Tuesday, the NZD/USD remains under significant technical pressure. Price action continues to waffle below the 200-day Simple Moving Average (SMA) currently dropping into 0.6100, and the immediate ceiling on an bullish extension sits at early October's swing high into the 0.6050 level.

Swing lows on the daily candlesticks have begun to chalk out a technical support zone from 0.5800 to 0.5900, but the 50-day SMA continues to draw in bids, trapping prices into downside momentum near the 0.5900 handle.

NZD/USD Daily Chart

NZD/USD Technical Levels

NZD/USD

Overview
Today last price0.6001
Today Daily Change0.0119
Today Daily Change %2.02
Today daily open0.5882
 
Trends
Daily SMA200.5872
Daily SMA500.5911
Daily SMA1000.6004
Daily SMA2000.6104
 
Levels
Previous Daily High0.5899
Previous Daily Low0.587
Previous Weekly High0.6002
Previous Weekly Low0.5877
Previous Monthly High0.6056
Previous Monthly Low0.5772
Daily Fibonacci 38.2%0.5881
Daily Fibonacci 61.8%0.5888
Daily Pivot Point S10.5868
Daily Pivot Point S20.5855
Daily Pivot Point S30.5839
Daily Pivot Point R10.5897
Daily Pivot Point R20.5913
Daily Pivot Point R30.5926

Author

Joshua Gibson

Joshua joins the FXStreet team as an Economics and Finance double major from Vancouver Island University with twelve years' experience as an independent trader focusing on technical analysis.

More from Joshua Gibson
Share:

Editor's Picks

GBP/USD bounces off lows, back above 1.3200

After bottoming out near 1.3160, GBP/USD manages to regain a bit of shine and reclaim the 1.3200 mark and beyond at the end of the week. Stronger-than-expected UK Retail Sales data seem to be helping the British Pound limit its losses, while the chaotic UK political environment keeps the bulls at bay for now.

EUR/USD looks consolidative around 1.1460

EUR/USD stages a modest rebound after slipping to a three-month low below 1.1420 at the end of the week. That said, the pair now looks to consolidate humble gains just above 1.1460 despite growing uncertainty surrounding the next round of US-Iran negotiations, which keeps the US Dollar’s downside contained.

Gold slips back to six-day lows, targets $4,100

Gold retreats for the third consecutive day on Friday, eroding gains seen in the first half of the week and approaching the key $4,100 mark per troy ounce. Indeed, the precious metal continues to face headwinds from the Fed's hawkish stance and renewed uncertainty surrounding the next round of US-Iran negotiations.

Solana extends correction despite ETF inflows, RWA adoption

Solana (SOL) price edges below $70 extending its losses for the fourth straight day this week. The institutional demand for Solana is building, with steady inflows so far this week and Morgan Stanley’s amended S-1 filing for a Solana-focused Exchange-Traded Fund.

The Iran war didn't break the US economy, but what happens next?

Nearly four months after the start of the Iran war, the US economy remains remarkably resilient. While the conflict initially triggered a severe disruption to global energy markets and a sharp rise in Oil prices, recent diplomatic progress between Washington and Tehran has eased concerns about a prolonged supply shock.

Regime change: Inside Kevin Warsh's first move to make the Fed unreadable on purpose

The rate did not move. That was the least interesting thing about Kevin Warsh's first meeting in charge of the Fed. The FOMC held its benchmark at 3.50%-3.75% for the fourth straight meeting, exactly as priced, and then the new chair used his first press conference to dismantle the machinery the market has leaned on for a decade.