NZD/USD Price Forecast: Sets to rally towards 0.6100
- NZD/USD refreshes seven-month high near 0.6055 as the NZ Dollar outperforms across the board.
- The NZD gains despite growing US-China trade worries.
- Disappointing US economic data weighs on US Treasury yields and the US Dollar.

The NZD/USD pair posts a fresh seven-month high near 0.6055 on Thursday. The Kiwi pair strengthens as the New Zealand Dollar (NZD) outperforms across the board despite growing uncertainty over trade relations between the United States (US) and China.
New Zealand Dollar PRICE Today
The table below shows the percentage change of New Zealand Dollar (NZD) against listed major currencies today. New Zealand Dollar was the strongest against the Japanese Yen.
| USD | EUR | GBP | JPY | CAD | AUD | NZD | CHF | |
|---|---|---|---|---|---|---|---|---|
| USD | -0.01% | -0.11% | 0.32% | -0.11% | -0.25% | -0.21% | 0.15% | |
| EUR | 0.00% | -0.05% | 0.33% | -0.08% | -0.23% | -0.28% | 0.19% | |
| GBP | 0.11% | 0.05% | 0.41% | -0.03% | -0.16% | -0.23% | 0.23% | |
| JPY | -0.32% | -0.33% | -0.41% | -0.44% | -0.62% | -0.63% | -0.16% | |
| CAD | 0.11% | 0.08% | 0.03% | 0.44% | -0.17% | -0.19% | 0.27% | |
| AUD | 0.25% | 0.23% | 0.16% | 0.62% | 0.17% | -0.07% | 0.41% | |
| NZD | 0.21% | 0.28% | 0.23% | 0.63% | 0.19% | 0.07% | 0.48% | |
| CHF | -0.15% | -0.19% | -0.23% | 0.16% | -0.27% | -0.41% | -0.48% |
The heat map shows percentage changes of major currencies against each other. The base currency is picked from the left column, while the quote currency is picked from the top row. For example, if you pick the New Zealand Dollar from the left column and move along the horizontal line to the US Dollar, the percentage change displayed in the box will represent NZD (base)/USD (quote).
On Wednesday, US President Donald Trump expressed difficulties in trade negotiations with Chinese leader XI Jinping. "I like President Xi of China, always have, and always will, but he is VERY TOUGH, AND EXTREMELY HARD TO MAKE A DEAL WITH!!!" Trump wrote in a post on Truth.Social.
Technically, the Kiwi Dollar underperforms when investors express concerns over China’s trade outlook, given that the New Zealand (NZ) economy relies heavily on its exports to Beijing.
Meanwhile, lower Treasury yields due to poor US ADP Employment Change and ISM Services PMI data for May have weighed heavily on the US Dollar (USD). At the time of writing, 10-year US bond yields extend its Wednesday’s downside move to near 4.33%. The US Dollar Index (DXY), which tracks the Greenback’s value against six major currencies, struggles to hold the six-week low of 98.60.
Soft US data has slightly prompted market expectations that the Federal Reserve (Fed) could lower interest rates in the July policy meeting.
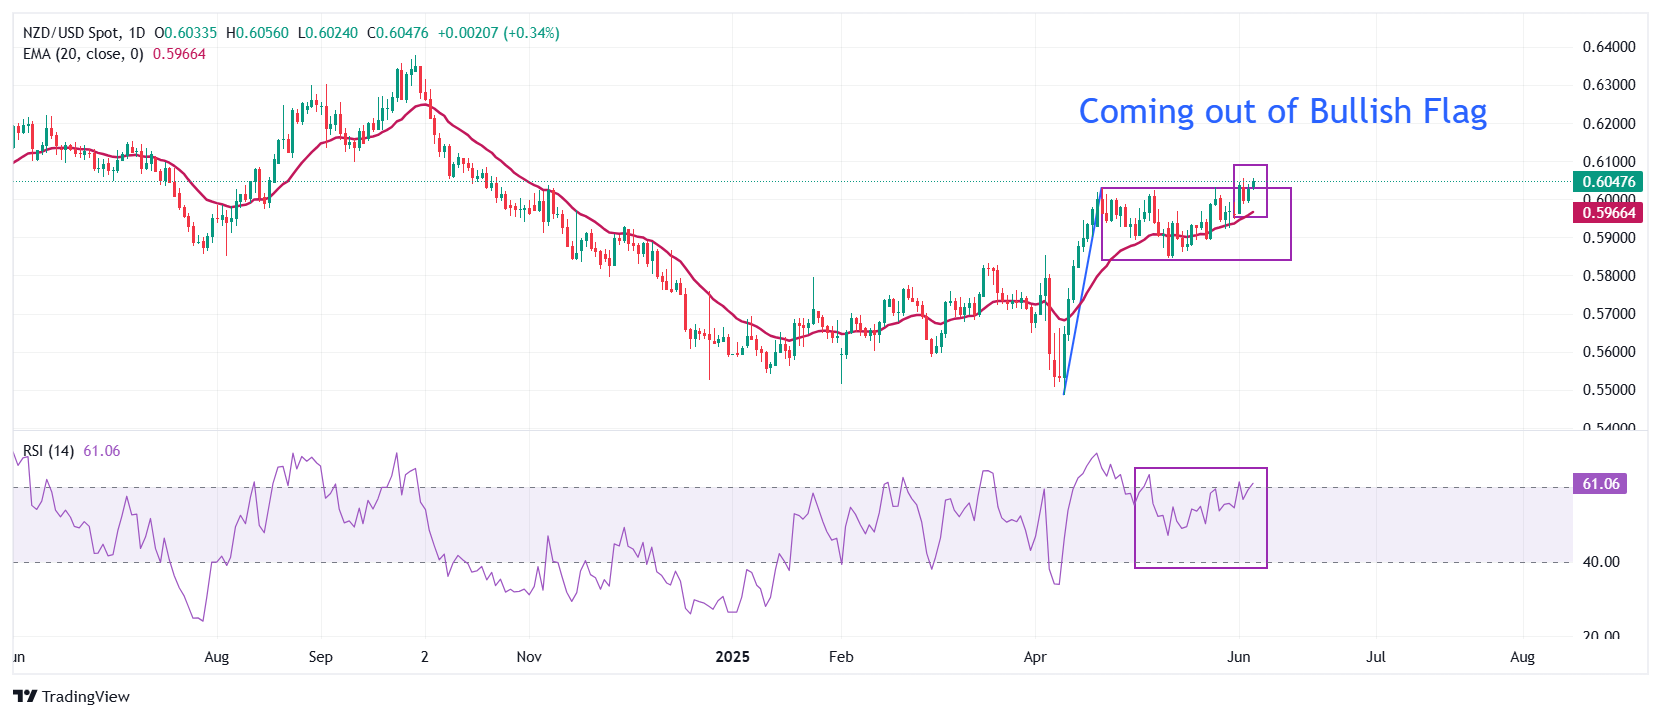
NZD/USD is almost set to break the Bullish Flag formation on the upside. Historically, the asset resumes its strong rally after a breakout of the consolidation seen in the chart pattern, which is in the range of 0.5846-0.6024. The near-term trend of the pair is bullish as the 20-day Exponential Moving Average (EMA) slopes higher around 0.5925.
The 14-day Relative Strength Index (RSI) breaks above 60.00. Bulls would come into action if the RSI holds above the 60.00 level.
The Kiwi pair is expected to rise towards the September 11 low of 0.6100 and the October 9 high of 0.6145 after staying above the key level of 0.6050.
In an alternate scenario, a downside move below the May 12 low of 0.5846 will expose it to the round-level support of 0.5800, followed by the April 10 high of 0.5767.
NZD/USD daily chart
US Dollar FAQs
The US Dollar (USD) is the official currency of the United States of America, and the ‘de facto’ currency of a significant number of other countries where it is found in circulation alongside local notes. It is the most heavily traded currency in the world, accounting for over 88% of all global foreign exchange turnover, or an average of $6.6 trillion in transactions per day, according to data from 2022. Following the second world war, the USD took over from the British Pound as the world’s reserve currency. For most of its history, the US Dollar was backed by Gold, until the Bretton Woods Agreement in 1971 when the Gold Standard went away.
The most important single factor impacting on the value of the US Dollar is monetary policy, which is shaped by the Federal Reserve (Fed). The Fed has two mandates: to achieve price stability (control inflation) and foster full employment. Its primary tool to achieve these two goals is by adjusting interest rates. When prices are rising too quickly and inflation is above the Fed’s 2% target, the Fed will raise rates, which helps the USD value. When inflation falls below 2% or the Unemployment Rate is too high, the Fed may lower interest rates, which weighs on the Greenback.
In extreme situations, the Federal Reserve can also print more Dollars and enact quantitative easing (QE). QE is the process by which the Fed substantially increases the flow of credit in a stuck financial system. It is a non-standard policy measure used when credit has dried up because banks will not lend to each other (out of the fear of counterparty default). It is a last resort when simply lowering interest rates is unlikely to achieve the necessary result. It was the Fed’s weapon of choice to combat the credit crunch that occurred during the Great Financial Crisis in 2008. It involves the Fed printing more Dollars and using them to buy US government bonds predominantly from financial institutions. QE usually leads to a weaker US Dollar.
Quantitative tightening (QT) is the reverse process whereby the Federal Reserve stops buying bonds from financial institutions and does not reinvest the principal from the bonds it holds maturing in new purchases. It is usually positive for the US Dollar.
Author

Sagar Dua
FXStreet
Sagar Dua is associated with the financial markets from his college days. Along with pursuing post-graduation in Commerce in 2014, he started his markets training with chart analysis.


