NZD/USD Price Forecast: Seems vulnerable near 0.5900 confluence on dismal NZ GDP print
- NZD/USD attracts heavy selling for the second straight day in reaction to dismal NZ Q2 GDP.
- The USD builds on the post-FOMC recovery from a multi-year low and also exerts pressure.
- Bears now await a break below the 0.5900 mark before positioning for a further downfall.

The NZD/USD pair extends the previous day's rejection slide from the 0.6000 psychological mark, or the highest level since July 27, and attracts strong follow-through selling on Thursday in the wake of the weaker-than-expected New Zealand GDP print. This marks the second straight day of decline and drags spot prices to an over one-week low during the Asian session, with bears now awaiting a sustained break below the 0.5900 mark before placing fresh bets.
Statistics New Zealand reported that the economy contracted by 0.9% QoQ in the second quarter, reversing a 0.8% rise recorded during the March quarter. The reading was weaker than consensus estimates for a 0.3% drop and lifted bets for more interest rate cuts by the Reserve Bank of New Zealand (RBNZ), which, in turn, is seen weighing heavily on the New Zealand Dollar (NZD). The US Dollar (USD), on the other hand, is looking to build on the previous day's post-FOMC recovery from the lowest level since February 2022 and is exerting additional pressure on the NZD/USD pair.
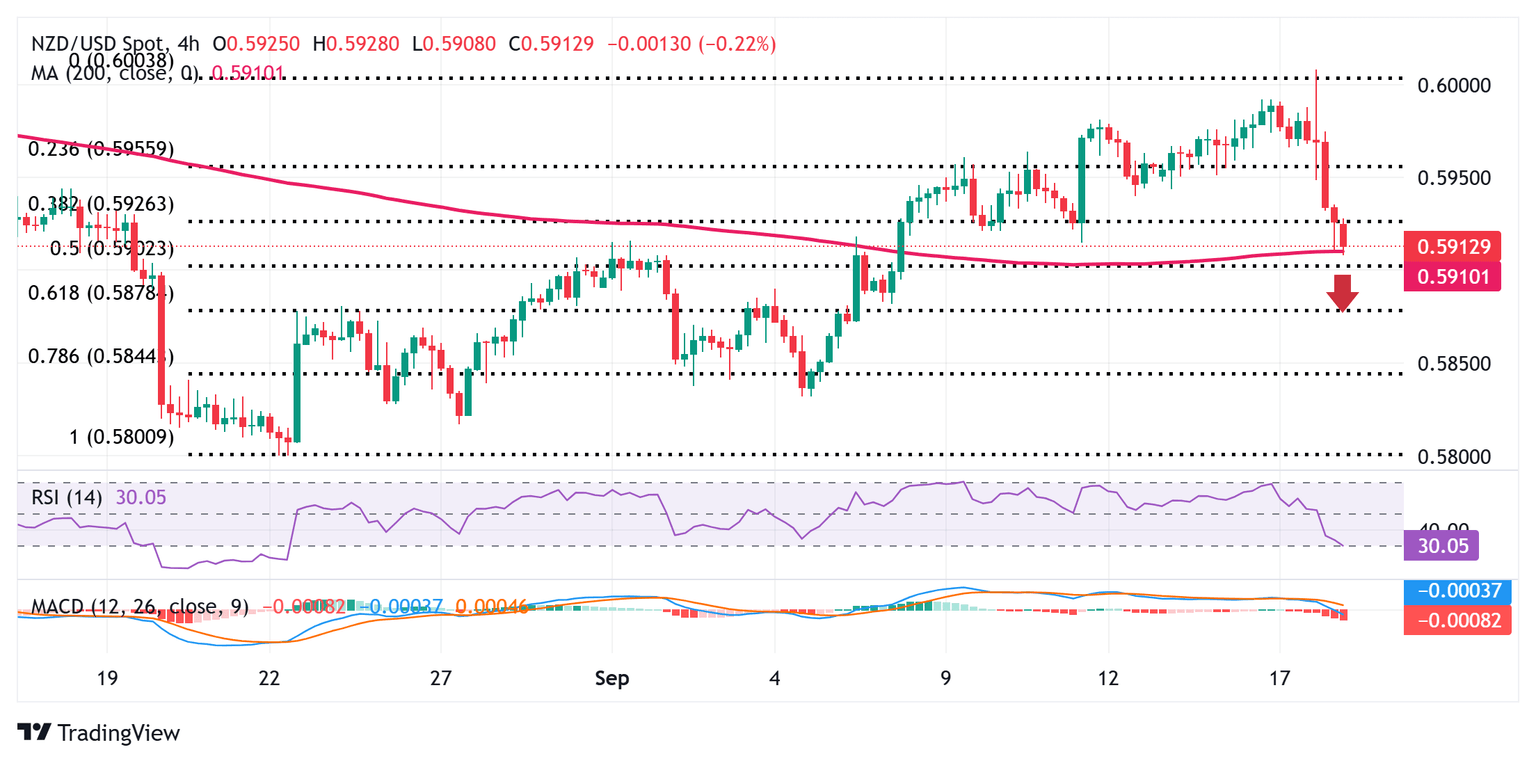
From a technical perspective, an intraday breakdown below the 0.5930-0.5925 area, representing the 38.2% Fibonacci retracement level of the recent recovery from an over four-month low touched in August, favors bearish traders. Moreover, oscillators on the daily chart have just started gaining negative traction and back the case for a further depreciating move. A break below the 0.5900 confluence, comprising the 200-period Simple Moving Average (SMA) on the 4-hour chart, and the 50% Fibo. level, will reaffirm the negative bias and drag the NZD/USD pair to the 0.5875 support zone.
The latter coincides with the 61.8% Fibo. level, below which the downward trajectory could extend further towards the 0.5835 intermediate support en route to the 0.5800 round figure, or the August swing low. Acceptance below the latter will be seen as a fresh trigger for bearish traders and pave the way for a further near-term depreciating move.
On the flip side, the 0.5935 support breakpoint (38.2% Fibo. level) now seems to act as an immediate hurdle ahead of the 0.5960 region. A sustained strength beyond the latter could allow the NZD/USD pair to make a fresh attempt towards conquering the 0.6000 psychological mark. Some follow-through buying would be seen as a fresh trigger for bullish traders and set the stage for additional gains towards the 0.6045 horizontal resistance en route to the 0.6100 mark. Spot prices could eventually climb to retest the year-to-date peak, around the 0.6120 region touched in July.
NZD/USD 4-hour chart
Economic Indicator
Gross Domestic Product (QoQ)
The Gross Domestic Product (GDP), released by Statistics New Zealand on a quarterly basis, is a measure of the total value of all goods and services produced in New Zealand during a given period. The GDP is considered as the main measure of New Zealand’s economic activity. The QoQ reading compares economic activity in the reference quarter to the previous quarter. Generally, a high reading is seen as bullish for the New Zealand Dollar (NZD), while a low reading is seen as bearish.
Read more.Last release: Wed Sep 17, 2025 22:45
Frequency: Quarterly
Actual: -0.9%
Consensus: -0.3%
Previous: 0.8%
Source: Stats NZ
The Gross Domestic Product (GDP), released by Statistics New Zealand, highlights the overall economic performance on a quarterly basis. The gauge has a significant influence on the Reserve Bank of New Zealand’s (RBNZ) monetary policy decision, in turn affecting the New Zealand dollar. A rise in the GDP rate signifies improvement in the economic conditions, which calls for tighter monetary policy, while a drop suggests deterioration in the activity. An above-forecast GDP reading is seen as NZD bullish.
Author

Haresh Menghani
FXStreet
Haresh Menghani is a detail-oriented professional with 10+ years of extensive experience in analysing the global financial markets.


