NZD/USD Price Forecast: Rallies to near 0.5750
- NZD/USD jumps to near 0.5750 as antipodeans outperform ahead of Trump’s tariff announcement.
- Donald Trump is expected to announce massive tariff measures for China.
- Trump’s tariffs will be bad for the global economy, including the US.

The NZD/USD pair advances to near 0.5745 during European trading hours on Wednesday. The Kiwi pair strengthens as antipodeans are outperforming their peers despite firm expectations that they will have collateral damage from reciprocal tariffs by the United States (US) that will be announced by President Donald Trump later in the day.
New Zealand Dollar PRICE Today
The table below shows the percentage change of New Zealand Dollar (NZD) against listed major currencies today. New Zealand Dollar was the strongest against the Canadian Dollar.
| USD | EUR | GBP | JPY | CAD | AUD | NZD | CHF | |
|---|---|---|---|---|---|---|---|---|
| USD | -0.09% | -0.16% | -0.15% | 0.08% | -0.49% | -0.76% | 0.05% | |
| EUR | 0.09% | -0.04% | -0.06% | 0.19% | -0.38% | -0.68% | 0.16% | |
| GBP | 0.16% | 0.04% | 0.02% | 0.23% | -0.33% | -0.61% | 0.20% | |
| JPY | 0.15% | 0.06% | -0.02% | 0.21% | -0.37% | -0.65% | 0.17% | |
| CAD | -0.08% | -0.19% | -0.23% | -0.21% | -0.57% | -0.83% | -0.03% | |
| AUD | 0.49% | 0.38% | 0.33% | 0.37% | 0.57% | -0.28% | 0.53% | |
| NZD | 0.76% | 0.68% | 0.61% | 0.65% | 0.83% | 0.28% | 0.82% | |
| CHF | -0.05% | -0.16% | -0.20% | -0.17% | 0.03% | -0.53% | -0.82% |
The heat map shows percentage changes of major currencies against each other. The base currency is picked from the left column, while the quote currency is picked from the top row. For example, if you pick the New Zealand Dollar from the left column and move along the horizontal line to the US Dollar, the percentage change displayed in the box will represent NZD (base)/USD (quote).
Market participants expect Trump to slap hefty tariffs on China in addition to 20% levies, applied since his return to the White House. Higher import duties on China will weaken its economic outlook, given that China is the largest trading partner of the US.
The impact of Trump’s tariff will be indirect on the New Zealand Dollar (NZD), given that the kiw economy relies significantly on its exports to the US.
Meanwhile, the US Dollar (USD) trades cautiously ahead of Trump’s tariff announcement. Investors expect that the new suite of tariffs by Trump will also impact the US economic growth and bring a resurgence in inflationary pressures in the near term.
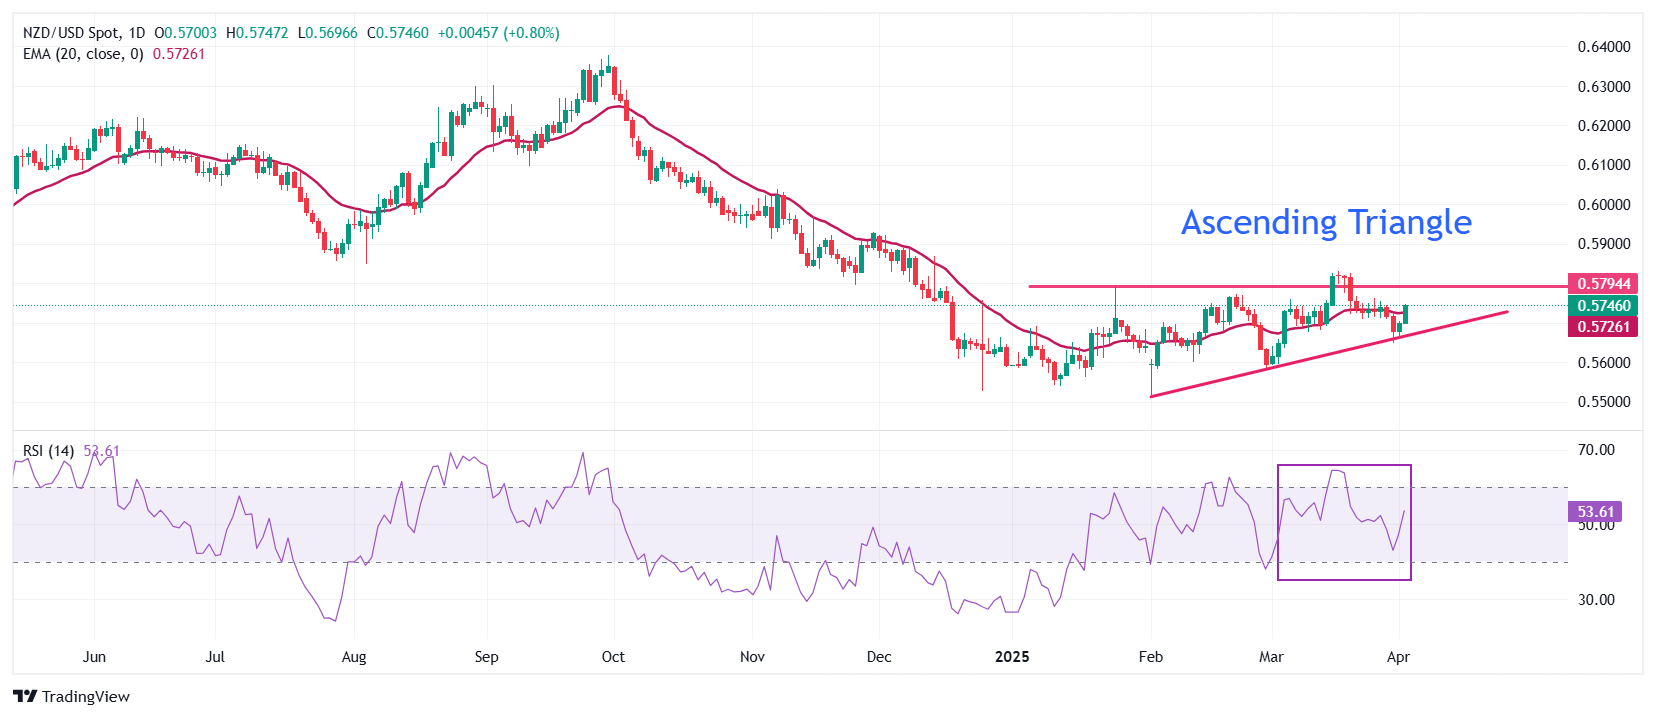
NZD/USD trades inside the Ascending Triangle chart pattern formation on the daily timeframe, suggesting indecisiveness among market participants. The flat border of the above-mentioned chart pattern is plotted from the January 24 high of 0.5795, while the upward-sloping border is placed from the February low of 0.5516.
The 20-day Exponential Moving Average (EMA) wobbles near the pair around 0.5725, which indicates a sideways trend.
The 14-day Relative Strength Index (RSI) oscillates inside the 40.00-60.00, which indicates a volatility contraction.
An upside move would appear if the asset breaks the March high of 0.5832, which will drive it towards the round-level resistance of 0.5900 and the November 29 high of 0.5930.
On the flip side, the Kiwi pair could revisit the 13-year low of 0.5470 and decline further to near the round-level support of 0.5400 if it breaks below the February low of 0.5516.
NZD/USD daily chart
US-China Trade War FAQs
Generally speaking, a trade war is an economic conflict between two or more countries due to extreme protectionism on one end. It implies the creation of trade barriers, such as tariffs, which result in counter-barriers, escalating import costs, and hence the cost of living.
An economic conflict between the United States (US) and China began early in 2018, when President Donald Trump set trade barriers on China, claiming unfair commercial practices and intellectual property theft from the Asian giant. China took retaliatory action, imposing tariffs on multiple US goods, such as automobiles and soybeans. Tensions escalated until the two countries signed the US-China Phase One trade deal in January 2020. The agreement required structural reforms and other changes to China’s economic and trade regime and pretended to restore stability and trust between the two nations. However, the Coronavirus pandemic took the focus out of the conflict. Yet, it is worth mentioning that President Joe Biden, who took office after Trump, kept tariffs in place and even added some additional levies.
The return of Donald Trump to the White House as the 47th US President has sparked a fresh wave of tensions between the two countries. During the 2024 election campaign, Trump pledged to impose 60% tariffs on China once he returned to office, which he did on January 20, 2025. With Trump back, the US-China trade war is meant to resume where it was left, with tit-for-tat policies affecting the global economic landscape amid disruptions in global supply chains, resulting in a reduction in spending, particularly investment, and directly feeding into the Consumer Price Index inflation.
Author

Sagar Dua
FXStreet
Sagar Dua is associated with the financial markets from his college days. Along with pursuing post-graduation in Commerce in 2014, he started his markets training with chart analysis.


