NZD/USD Price Forecast: Pulls back from 0.6050 near seven-month highs
- NZD/USD may target its fresh seven-month high of 0.6055, marked on Tuesday.
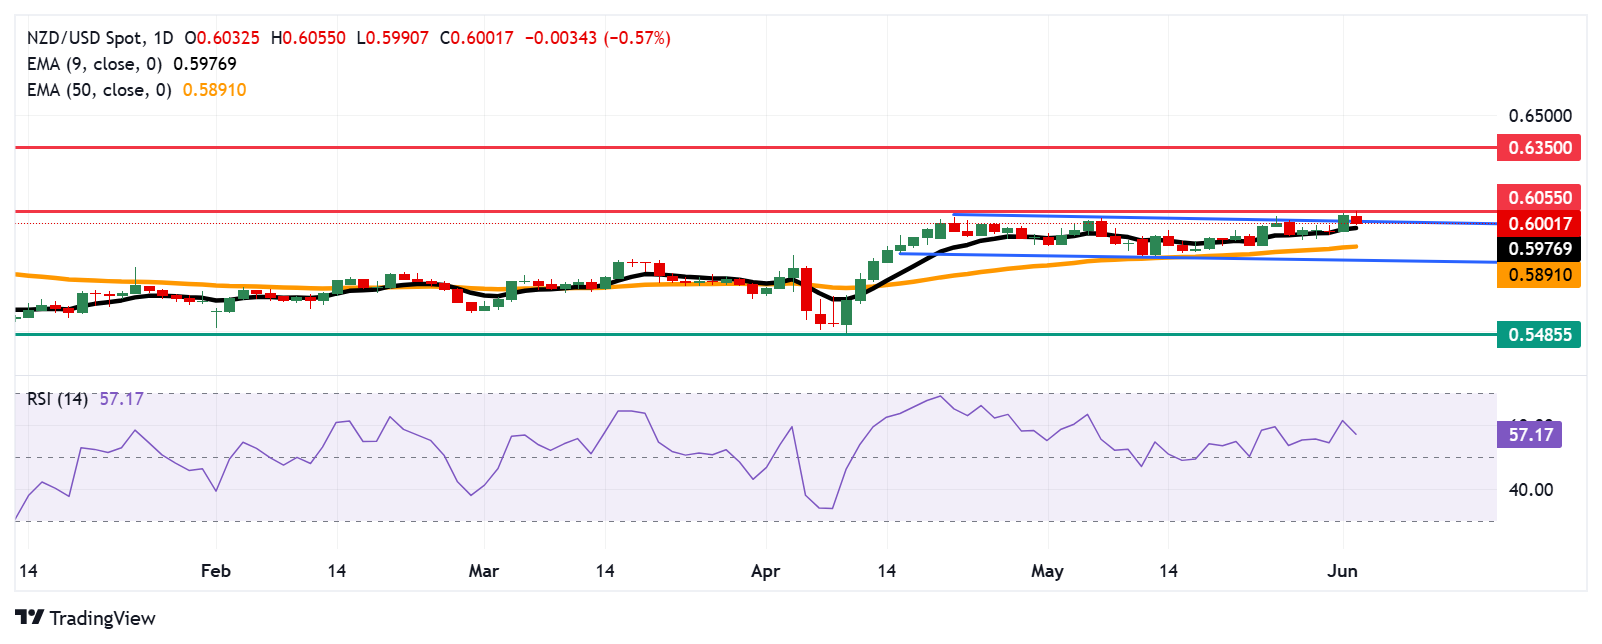
- The 14-day Relative Strength Index is positioned above the 50 mark, suggesting a persistent bullish bias.
- The nine-day EMA of 0.5976 appears as the primary support within the rectangular pattern.

NZD/USD is retracing its recent losses, trading around 0.5990 during the European hours on Tuesday. The technical analysis of the daily chart suggests a revival of neutral market sentiment as the Kiwi pair is attempting to fall back within a rectangular pattern.
However, the pair depreciates despite a stronger short-term price momentum, positioning above a nine-day Exponential Moving Average (EMA). Additionally, the bullish bias persists as the 14-day Relative Strength Index (RSI) is maintaining its position above the 50 mark.
On the upside, the NZD/USD pair may again target the fresh seven-month high of 0.6055, recorded earlier in the Asian session. A successful breach above this key resistance zone could reinforce the bullish bias and open the doors for the pair to explore the region around the eight-month high of 0.6350, marked in October 2024.
A downside return to the rectangular pattern could prompt the pair to test the nine-day EMA of 0.5976, followed by the 50-day EMA at 0.5891. A break below these levels could weaken the short- and medium-term price momentum and put downward pressure on the pair to test the rectangle’s lower boundary around 0.5830.
Further decline beneath the rectangle pattern could cause the emergence of the bearish bias and pave the way for a deeper decline toward 0.5485, a level not seen since March 2020.
NZD/USD: Daily Chart
New Zealand Dollar PRICE Today
The table below shows the percentage change of New Zealand Dollar (NZD) against listed major currencies today. New Zealand Dollar was the weakest against the US Dollar.
| USD | EUR | GBP | JPY | CAD | AUD | NZD | CHF | |
|---|---|---|---|---|---|---|---|---|
| USD | 0.29% | 0.24% | 0.06% | 0.12% | 0.58% | 0.56% | 0.18% | |
| EUR | -0.29% | -0.03% | -0.21% | -0.15% | 0.30% | 0.35% | -0.10% | |
| GBP | -0.24% | 0.03% | -0.19% | -0.12% | 0.34% | 0.38% | -0.07% | |
| JPY | -0.06% | 0.21% | 0.19% | 0.06% | 0.50% | 0.52% | 0.18% | |
| CAD | -0.12% | 0.15% | 0.12% | -0.06% | 0.41% | 0.51% | 0.05% | |
| AUD | -0.58% | -0.30% | -0.34% | -0.50% | -0.41% | 0.05% | -0.42% | |
| NZD | -0.56% | -0.35% | -0.38% | -0.52% | -0.51% | -0.05% | -0.45% | |
| CHF | -0.18% | 0.10% | 0.07% | -0.18% | -0.05% | 0.42% | 0.45% |
The heat map shows percentage changes of major currencies against each other. The base currency is picked from the left column, while the quote currency is picked from the top row. For example, if you pick the New Zealand Dollar from the left column and move along the horizontal line to the US Dollar, the percentage change displayed in the box will represent NZD (base)/USD (quote).
Author

Akhtar Faruqui
FXStreet
Akhtar Faruqui is a Forex Analyst based in New Delhi, India. With a keen eye for market trends and a passion for dissecting complex financial dynamics, he is dedicated to delivering accurate and insightful Forex news and analysis.


