NZD/USD Price Forecast: Kiwi Dollar outperforms ahead of US NFP data
- NZD/USD advances to near 0.5870 as the New Zealand Dollar outperforms its peers.
- Investors await key US NFP data for August.
- The Fed is expected to cut interest rates in the policy meeting this month.

The NZD/USD pair trades 0.45% higher around 0.5870 during the European trading hours on Friday. The Kiwi pair strengthens as the New Zealand Dollar (NZD) outperforms its peers amid risk-on market mood.
New Zealand Dollar Price Today
The table below shows the percentage change of New Zealand Dollar (NZD) against listed major currencies today. New Zealand Dollar was the strongest against the US Dollar.
| USD | EUR | GBP | JPY | CAD | AUD | NZD | CHF | |
|---|---|---|---|---|---|---|---|---|
| USD | -0.20% | -0.17% | -0.07% | -0.14% | -0.40% | -0.43% | -0.23% | |
| EUR | 0.20% | 0.05% | 0.02% | 0.06% | -0.11% | -0.21% | -0.02% | |
| GBP | 0.17% | -0.05% | 0.02% | 0.00% | -0.14% | -0.24% | -0.03% | |
| JPY | 0.07% | -0.02% | -0.02% | 0.01% | -0.23% | -0.30% | 0.04% | |
| CAD | 0.14% | -0.06% | -0.01% | -0.01% | -0.20% | -0.29% | -0.06% | |
| AUD | 0.40% | 0.11% | 0.14% | 0.23% | 0.20% | -0.12% | 0.12% | |
| NZD | 0.43% | 0.21% | 0.24% | 0.30% | 0.29% | 0.12% | 0.24% | |
| CHF | 0.23% | 0.02% | 0.03% | -0.04% | 0.06% | -0.12% | -0.24% |
The heat map shows percentage changes of major currencies against each other. The base currency is picked from the left column, while the quote currency is picked from the top row. For example, if you pick the New Zealand Dollar from the left column and move along the horizontal line to the US Dollar, the percentage change displayed in the box will represent NZD (base)/USD (quote).
S&P 500 futures trade higher during the European trading session, demonstrating an increase in the risk appetite of investors.
Meanwhile, the US Dollar (USD) faces selling pressure ahead of the United States (US) Nonfarm Payrolls (NFP) data for August, which will be published at 12:30 GMT. Investors will pay close attention to the US official labor market data as it will influence market expectations for the Federal Reserve’s (Fed) monetary policy outlook.
The US NFP report for August is expected to show that employers hired 75K fresh workers, almost in line with the prior reading of 73K. The Unemployment Rate is seen accelerating to 4.3% from the former release of 4.2%.
According to the CME FedWatch tool, the Fed is widely anticipated to cut interest rates in the policy meeting this month.
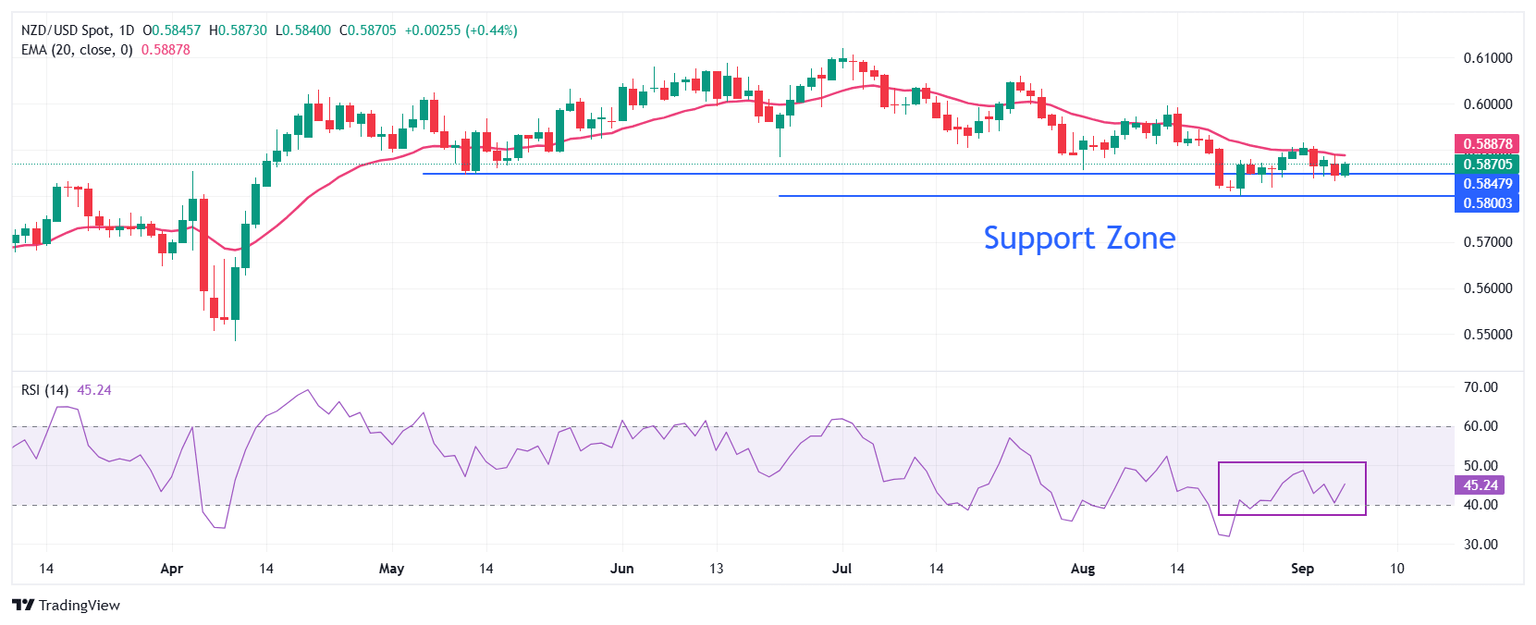
NZD/USD continues to face selling pressure near the 20-day Exponential Moving Average (EMA), which trades around 0.5887.
The 14-day Relative Strength Index (RSI) slides to near 40.00. A fresh bearish momentum would emerge if the RSI breaks below that level.
Going forward, a downside move by the pair below the August 2 low of 0.5800 will expose it to the April 11 low of 0.5730, followed by the round-level support of 0.5700.
In an alternate scenario, the Kiwi pair would rise towards the June 19 high of 0.6040 and the September 11 low of 0.6100 if it manages to return above the psychological level of 0.6000.
NZD/USD daily chart
Economic Indicator
Nonfarm Payrolls
The Nonfarm Payrolls release presents the number of new jobs created in the US during the previous month in all non-agricultural businesses; it is released by the US Bureau of Labor Statistics (BLS). The monthly changes in payrolls can be extremely volatile. The number is also subject to strong reviews, which can also trigger volatility in the Forex board. Generally speaking, a high reading is seen as bullish for the US Dollar (USD), while a low reading is seen as bearish, although previous months' reviews and the Unemployment Rate are as relevant as the headline figure. The market's reaction, therefore, depends on how the market assesses all the data contained in the BLS report as a whole.
Read more.Next release: Fri Sep 05, 2025 12:30
Frequency: Monthly
Consensus: 75K
Previous: 73K
Source: US Bureau of Labor Statistics
America’s monthly jobs report is considered the most important economic indicator for forex traders. Released on the first Friday following the reported month, the change in the number of positions is closely correlated with the overall performance of the economy and is monitored by policymakers. Full employment is one of the Federal Reserve’s mandates and it considers developments in the labor market when setting its policies, thus impacting currencies. Despite several leading indicators shaping estimates, Nonfarm Payrolls tend to surprise markets and trigger substantial volatility. Actual figures beating the consensus tend to be USD bullish.
Author

Sagar Dua
FXStreet
Sagar Dua is associated with the financial markets from his college days. Along with pursuing post-graduation in Commerce in 2014, he started his markets training with chart analysis.


