NZD/USD Price Forecast: Holds above mid-0.5900s despite disappointing Chinese data
- NZD/USD regains positive traction following Friday’s pullback from a nearly one-month top.
- A weaker USD offsets disappointing Chinese macro data and offers support to spot prices.
- The technical setup favors bulls and backs the case for a further near-term move higher.

The NZD/USD pair attracts some dip-buyers at the start of a new week and stalls Friday's modest pullback from the 0.5980 region, or a nearly one-month high. Spot prices currently trade around the 0.5960-0.5965 region and draw support from the prevalent bearish sentiment surrounding the US Dollar (USD).
In fact, the USD Index (DXY), which tracks the Greenback against a basket of currencies, languishes near its lowest level since July 24 amid the growing acceptance that the US Federal Reserve (Fed) will cut interest rates this week. Moreover, a positive tone around the equity markets undermines the safe-haven buck and benefits the risk-sensitive Kiwi, which seems unaffected by mostly disappointing Chinese macroeconomic data.
The National Bureau of Statistics (NBS) reported earlier this Monday that China’s Retail Sales rose 3.4% YoY in August vs. 3.8% expected and 3.7% previous. A separate report showed that China's Industrial Production increased 5.2% YoY, compared to the 5.8% forecast and 5.7% in July. Meanwhile, the Fixed Asset Investment came in at 0.5% year-to-date (YTD) in August, missing the 1.4% expected and the previous reading of 1.6%.
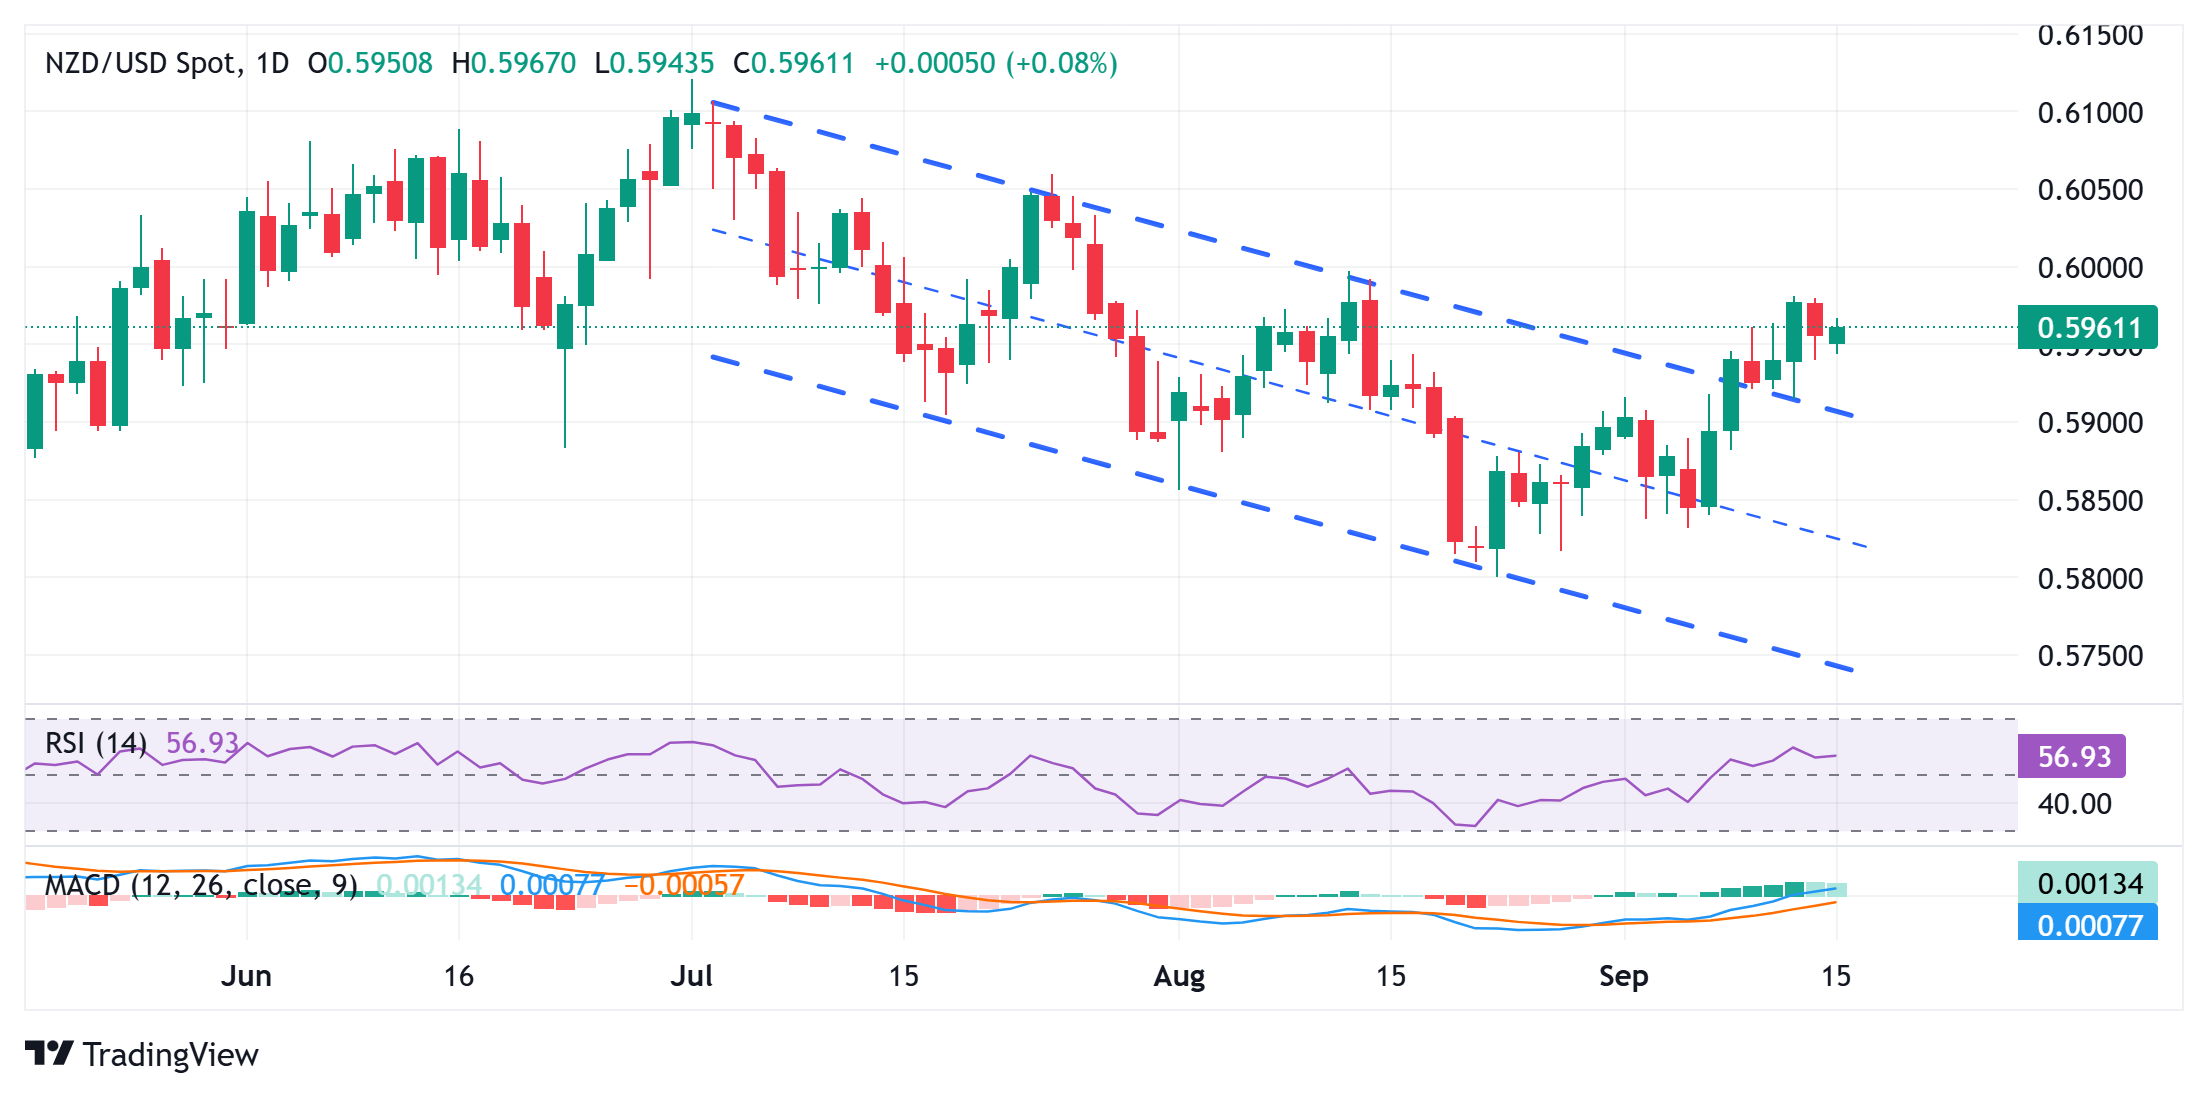
From a technical perspective, last week's breakout through a short-term descending trend-channel extending from the YTD top, touched in July, was seen as a fresh trigger for bullish traders. Moreover, oscillators on the daily chart have just started gaining positive traction and back the case for further gains for the NZD/USD pair. Hence, a subsequent strength, towards the 0.6000 psychological mark, looks like a distinct possibility.
Some follow-through buying will set the stage for a move towards the next relevant hurdle near the 0.6035 region en route to the 0.6060 area. The NZD/USD pair might eventually aim towards reclaiming the 0.6100 round figure for the first time since early July and climb further towards challenging the YTD peak, around the 0.6120 region.
On the flip side, any meaningful corrective pullback might be seen as a buying opportunity and is likely to remain cushioned near the ascending channel resistance breakpoint, currently around the 0.5900 round figure. A convincing break below the said handle, however, might prompt some technical selling and drag the NZD/USD pair to the 0.5945 intermediate support en route to the 0.5800 mark, or an over four-month low set in August.
NZD/USD daily chart
Economic Indicator
Retail Sales (YoY)
The Retail Sales data, released by the National Bureau of Statistics of China on a monthly basis, measures the value of goods sold by retailers in China. Changes in Retail Sales are widely followed as an indicator of consumer spending. Percent changes reflect the rate of changes in such sales, with the YoY reading comparing sales values in the reference month with the same month a year earlier. Generally, a high reading is seen as bullish for the Renminbi (CNY), while a low reading is seen as bearish.
Read more.Last release: Mon Sep 15, 2025 02:00
Frequency: Monthly
Actual: 3.4%
Consensus: 3.8%
Previous: 3.7%
Author

Haresh Menghani
FXStreet
Haresh Menghani is a detail-oriented professional with 10+ years of extensive experience in analysing the global financial markets.

















