NZD/USD Price Forecast: Bear move almost reaches target but MACD crosses higher
- NZD/USD falls in a three-wave ABC pattern with wave C reaching to within a pip of its downside target.
- The MACD is turning higher in a bullish-looking turn which could signal a change in the trend cycle.

NZD/USD has fallen in the C wave of a bearish ABC pattern which began life at the September 30 highs.
ABCs are zig-zag patterns in which waves A and C are usually of a similar length or a Fibonacci 61.8% of the other.
NZD/USD Daily Chart
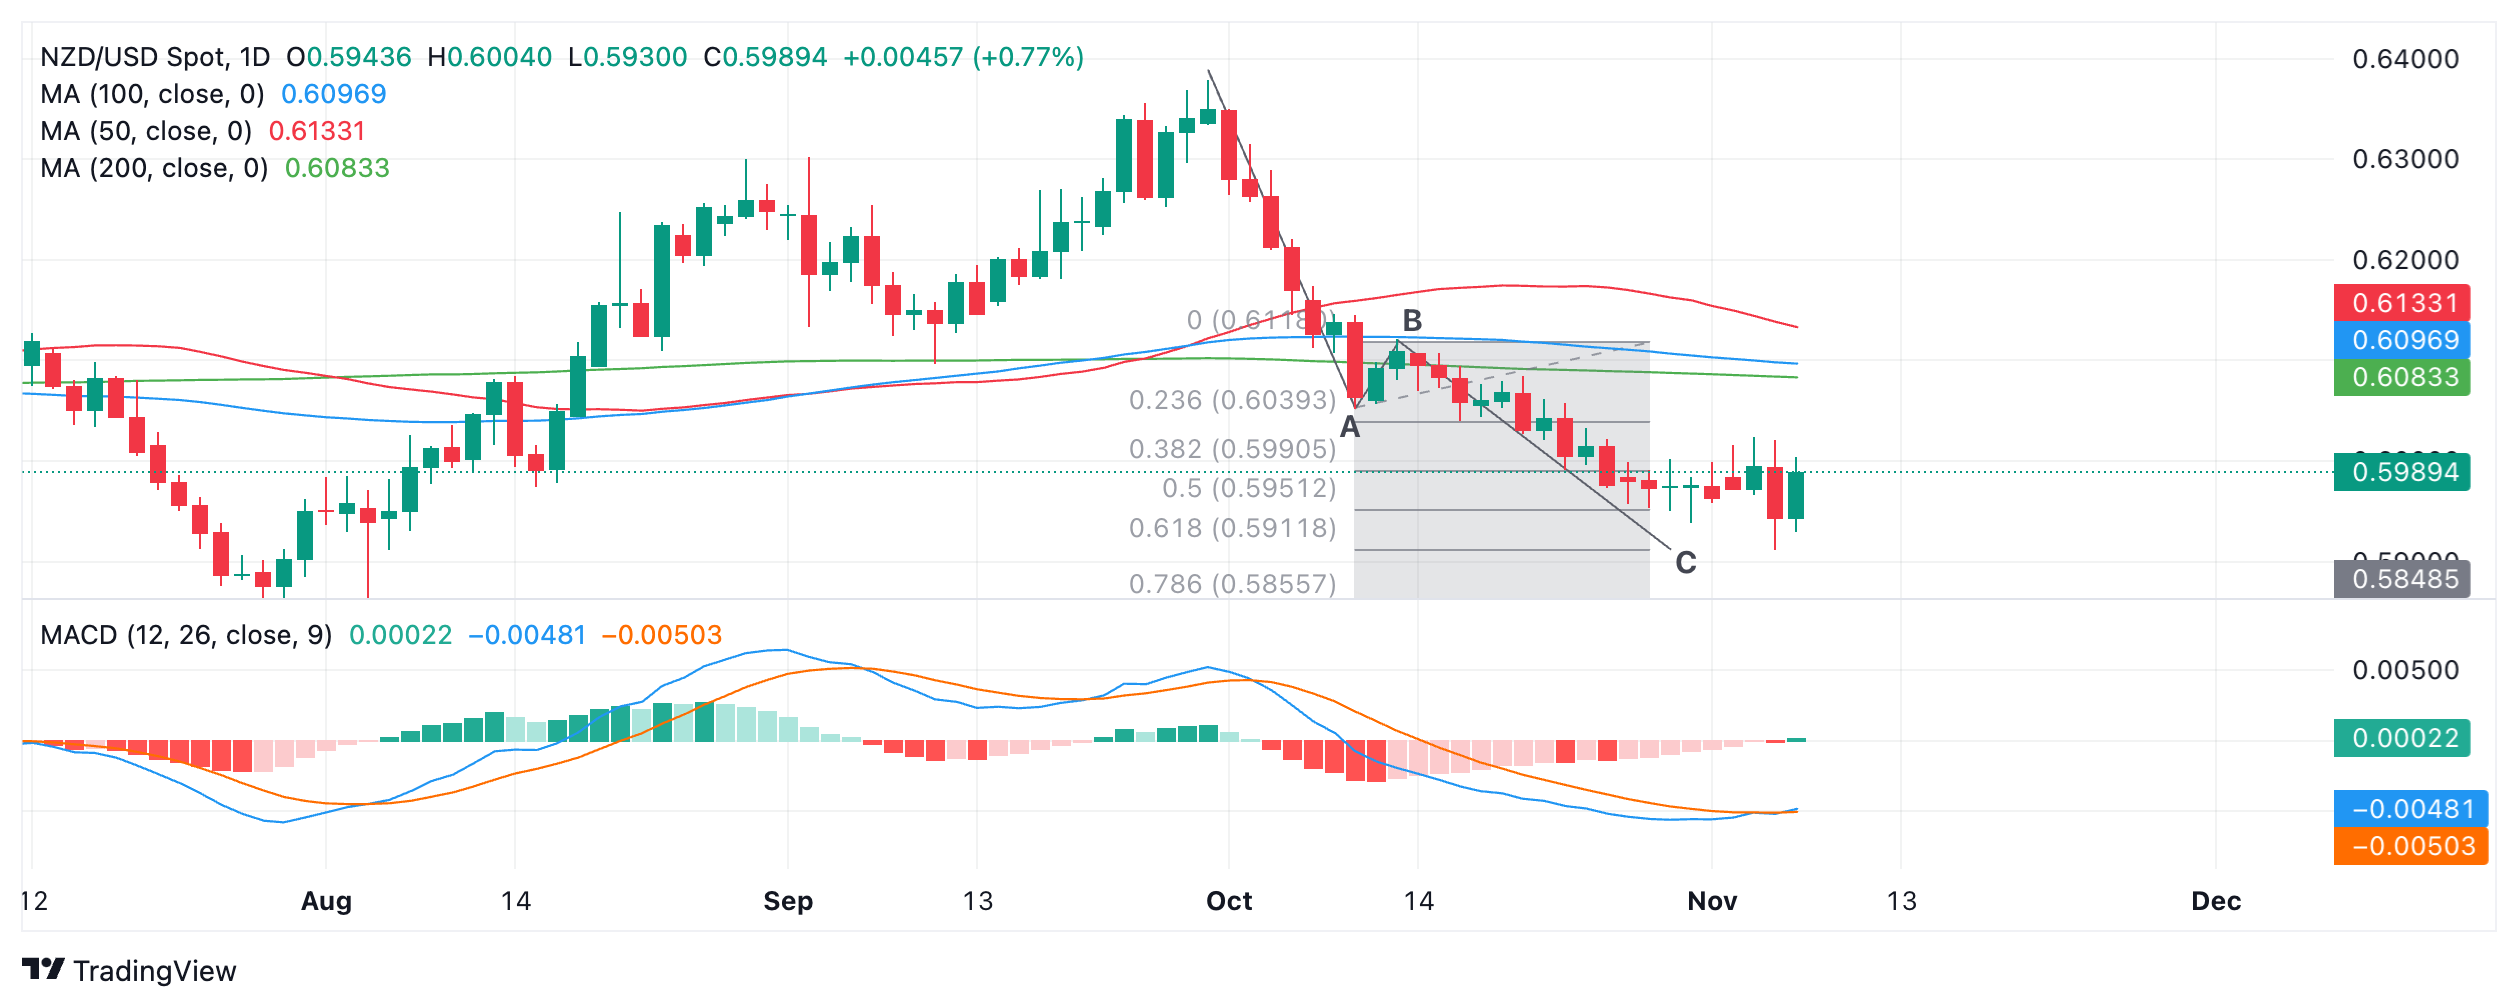
NZD/USD fell to 0.5912 on November 6, one pip above the 0.5911 minimum estimated endpoint of wave C as 61.8% of the length of A. It is possible we can take this as the pair reaching its target given one pip lies within a margin of error, however, it is also still possible that it could still fall further and properly hit the downside target.
In a really bearish scenario the Kiwi pair could even fall all the way to the major support level at 0.5849 (August 5 low).
The pair remains in a bearish short and medium-term downtrend, and given the technical analysis theory that “the trend is your friend” it is biased to decline further. On a long-term basis the pair is in a sideways trending consolidation.
The (blue) Moving Average Convergence Divergence (MACD) momentum indicator line is turning above its red signal line giving a fairly strong buy signal. This is a bullish signal and could indicate the short and medium-term trends are turning up, however, it is still too soon to be confident. If NZD/USD is about to turn higher it would be more or less in line with the pair reaching the floor of the long-term range.
Author

Joaquin Monfort
FXStreet
Joaquin Monfort is a financial writer and analyst with over 10 years experience writing about financial markets and alt data. He holds a degree in Anthropology from London University and a Diploma in Technical analysis.


![How Wall Street rigs the game [Video]](https://editorial.fxsstatic.com/images/i/market-chaos-01.jpg)














