NZD/USD Price Forecast: Advances to near 0.6200; next barrier at seven-month highs
- The daily chart analysis of the NZD/USD pair suggests that selling pressure is weakening and signals a potential bullish reversal.
- The pair may explore the area around its seven-month high of 0.6247.
- The nine-day EMA at 0.6181 level appears as an immediate support, followed by the upper boundary of the descending wedge.

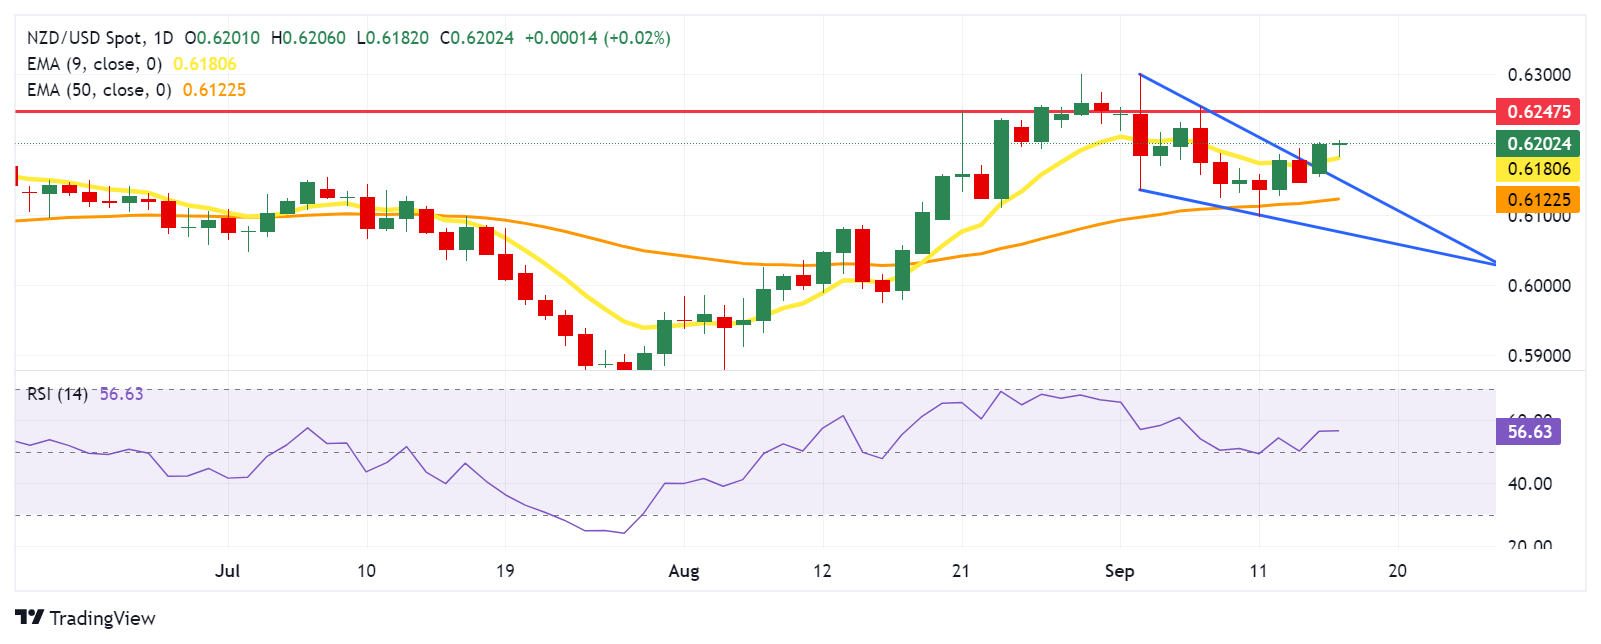
NZD/USD trades around 0.6200 during the European session on Tuesday. On the daily chart, the NZD/USD pair has breached the upper boundary of the descending wedge. This suggests that selling pressure is weakening, and it can signal a potential bullish reversal, especially if followed by an upward breakout.
The 14-day Relative Strength Index (RSI) remains above the 50 level, signaling a bullish trend. Furthermore, the nine-day Exponential Moving Average (EMA) is above the 14-day EMA, indicating that the NZD/USD pair is experiencing short-term upward momentum and is expected to continue its rise.
On the upside, the NZD/USD pair seems to explore the region around its seven-month high of 0.6247 recorded on August 21. A break above this level could drive the pair toward the psychological level of 0.6300.
In terms of support, the NZD/USD pair may test the immediate nine-day EMA at 0.6181 level, followed by the upper boundary of the descending wedge at 0.6150 level. A return to the descending wedge may reinforce the bearish bias and put pressure on the pair to test the 50-day EMA at the 0.6122 level, followed by the lower boundary of the descending wedge at the 0.6080 level.
NZD/USD: Daily Chart
New Zealand Dollar PRICE Today
The table below shows the percentage change of New Zealand Dollar (NZD) against listed major currencies today. New Zealand Dollar was the strongest against the US Dollar.
| USD | EUR | GBP | JPY | CAD | AUD | NZD | CHF | |
|---|---|---|---|---|---|---|---|---|
| USD | -0.03% | -0.01% | 0.00% | -0.01% | -0.15% | -0.05% | -0.16% | |
| EUR | 0.03% | 0.02% | 0.02% | -0.01% | -0.14% | -0.03% | -0.12% | |
| GBP | 0.00% | -0.02% | 0.00% | 0.00% | -0.16% | -0.04% | -0.18% | |
| JPY | 0.00% | -0.02% | 0.00% | -0.01% | -0.15% | -0.05% | -0.19% | |
| CAD | 0.00% | 0.01% | -0.00% | 0.01% | -0.14% | -0.03% | -0.18% | |
| AUD | 0.15% | 0.14% | 0.16% | 0.15% | 0.14% | 0.10% | -0.05% | |
| NZD | 0.05% | 0.03% | 0.04% | 0.05% | 0.03% | -0.10% | -0.14% | |
| CHF | 0.16% | 0.12% | 0.18% | 0.19% | 0.18% | 0.05% | 0.14% |
The heat map shows percentage changes of major currencies against each other. The base currency is picked from the left column, while the quote currency is picked from the top row. For example, if you pick the New Zealand Dollar from the left column and move along the horizontal line to the US Dollar, the percentage change displayed in the box will represent NZD (base)/USD (quote).
Author

Akhtar Faruqui
FXStreet
Akhtar Faruqui is a Forex Analyst based in New Delhi, India. With a keen eye for market trends and a passion for dissecting complex financial dynamics, he is dedicated to delivering accurate and insightful Forex news and analysis.


