|

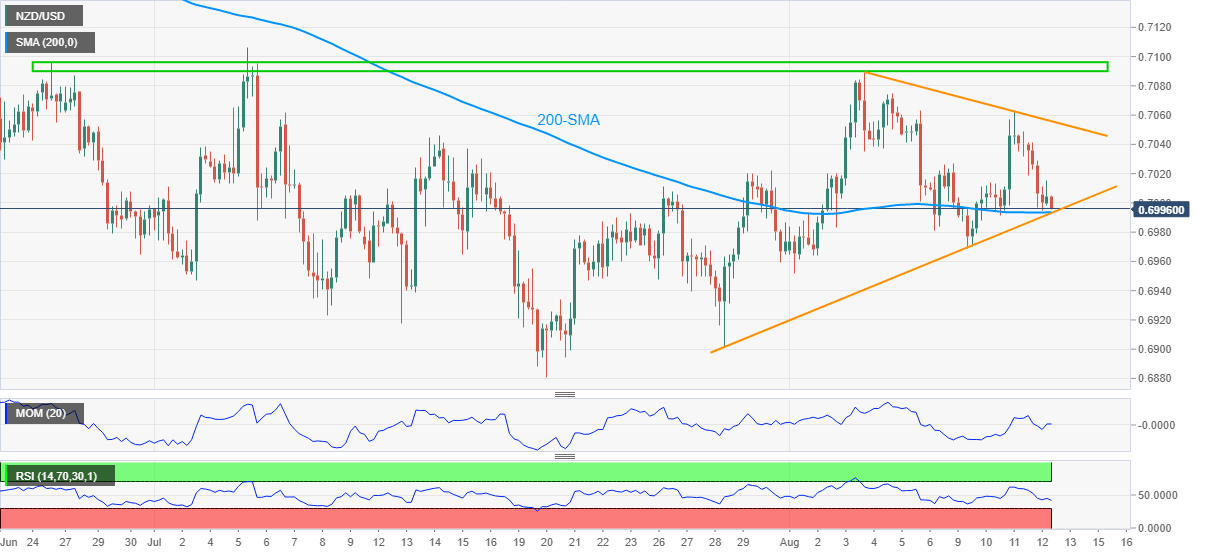
NZD/USD Price Analysis: Sellers attack 0.7000 support confluence

  • NZD/USD drops back to 200-SMA, 12-day-old support line.
  • Downbeat RSI, Momentum lines join failures to cross horizontal area from late June favor bears.
  • Weekly falling trend line adds to the upside filters.

NZD/USD takes offers around 0.6996, down 0.10% intraday, amid early Friday. In doing so, the kiwi pair fades the previous day’s bounce off 200-SMA as sellers battle the key support convergence including the stated moving average and an ascending support line from July 28.

Given the downward sloping RSI line, not oversold, joining the weak Momentum, not to forget the pair’s failures to rise past a seven-week-old horizontal resistance during the last week, NZD/USD sellers seem to have an upper hand.

Hence, a clear downside break of the 0.7000 confluence will quickly drag the quote to refresh the weekly low, around 0.6968 by the press time.

It should be noted, however, the 0.6920 and July’s low near 0.6880 can challenge NZD/USD bears afterward.

Alternatively, the corrective pullback may remain less important until staying below a one-week-long falling resistance line, around 0.7055.

Even so, NZD/USD bulls remain skeptical of the pair’s further unless witnessing clear trading beyond the stated multi-day-old horizontal area surrounding 0.7090–7100.

NZD/USD: Four-hour chart

Trend: Further weakness expected

Additional important levels

Overview
Today last price0.6996
Today Daily Change-0.0005
Today Daily Change %-0.07%
Today daily open0.7001
 
Trends
Daily SMA200.699
Daily SMA500.7027
Daily SMA1000.7096
Daily SMA2000.7109
 
Levels
Previous Daily High0.7049
Previous Daily Low0.6995
Previous Weekly High0.7089
Previous Weekly Low0.6952
Previous Monthly High0.7106
Previous Monthly Low0.6881
Daily Fibonacci 38.2%0.7016
Daily Fibonacci 61.8%0.7028
Daily Pivot Point S10.6981
Daily Pivot Point S20.6961
Daily Pivot Point S30.6927
Daily Pivot Point R10.7035
Daily Pivot Point R20.7069
Daily Pivot Point R30.7089

Author

Anil Panchal

Anil Panchal

FXStreet

Anil Panchal has nearly 15 years of experience in tracking financial markets. With a keen interest in macroeconomics, Anil aptly tracks global news/updates and stays well-informed about the global financial moves and their implications.

More from Anil Panchal
Share:

Editor's Picks

EUR/USD accelerates losses, focus is on 1.1800

EUR/USD’s selling pressure is gathering pace now, opening the door to a potential test of the key 1.1800 region sooner rather than later. The pair’s pullback comes on the back of marked gains in the US Dollar following US data releases and the publication of the FOMC Minutes later in the day.

GBP/USD turns negative near 1.3540

GBP/USD reverses its initial upside momentum and is now adding to previous declines, revisiting at the same time the 1.3540 region on Wednesday. Cable’s downtick comes on the back of decent gains in the Greenback and easing UK inflation figures, which seem to have reinforced the case for a BoE rate cut in March.

Gold battle to regain $5,000 continues

Gold is back on the front foot on Wednesday, shaking off part of the early week softness and challenging two-day highs just above the key $5,000 mark per troy ounce. The move comes ahead of the FOMC Minutes and is unfolding despite an intense rebound in the US Dollar.

Fed Minutes to shed light on January hold decision amid hawkish rate outlook

The Minutes of the Fed’s January 27-28 monetary policy meeting will be published today. Details of discussions on the decision to leave the policy rate unchanged will be scrutinized by investors.

Mixed UK inflation data no gamechanger for the Bank of England

Food inflation plunged in January, but service sector price pressure is proving stickier. We continue to expect Bank of England rate cuts in March and June. The latest UK inflation read is a mixed bag for the Bank of England, but we doubt it drastically changes the odds of a March rate cut.

Sui extends sideways action ahead of Grayscale’s GSUI ETF launch

Sui is extending its downtrend for the second consecutive day, trading at 0.95 at the time of writing on Wednesday. The Layer-1 token is down over 16% in February and approximately 34% from the start of the year, aligning with the overall bearish sentiment across the crypto market.