USD/JPY Price Forecast: Volatility fades as pair holds near mid-Bollinger Band
- USD/JPY advances as firmer US data supports the Greenback.
- FOMC Meeting Minutes in focus for fresh monetary policy signals.
- From a chart perspective, bias remains neutral, though a decisive push above 155.00 may pave the way toward 158.00.

The Japanese Yen (JPY) weakens against the US Dollar (USD) on Wednesday, with USD/JPY climbing nearly 0.78% as renewed demand for the Greenback underpins the pair. At the time of writing, USD/JPY is trading around 154.48.
The move comes as the US Dollar finds fresh support from resilient US economic data, prompting traders to trim near-term expectations for Federal Reserve (Fed) easing.
Market focus now shifts to the release of the Federal Open Market Committee (FOMC) Meeting Minutes later in the American trading session, which could provide further clarity on the Fed’s monetary policy outlook and influence short-term direction for the pair.
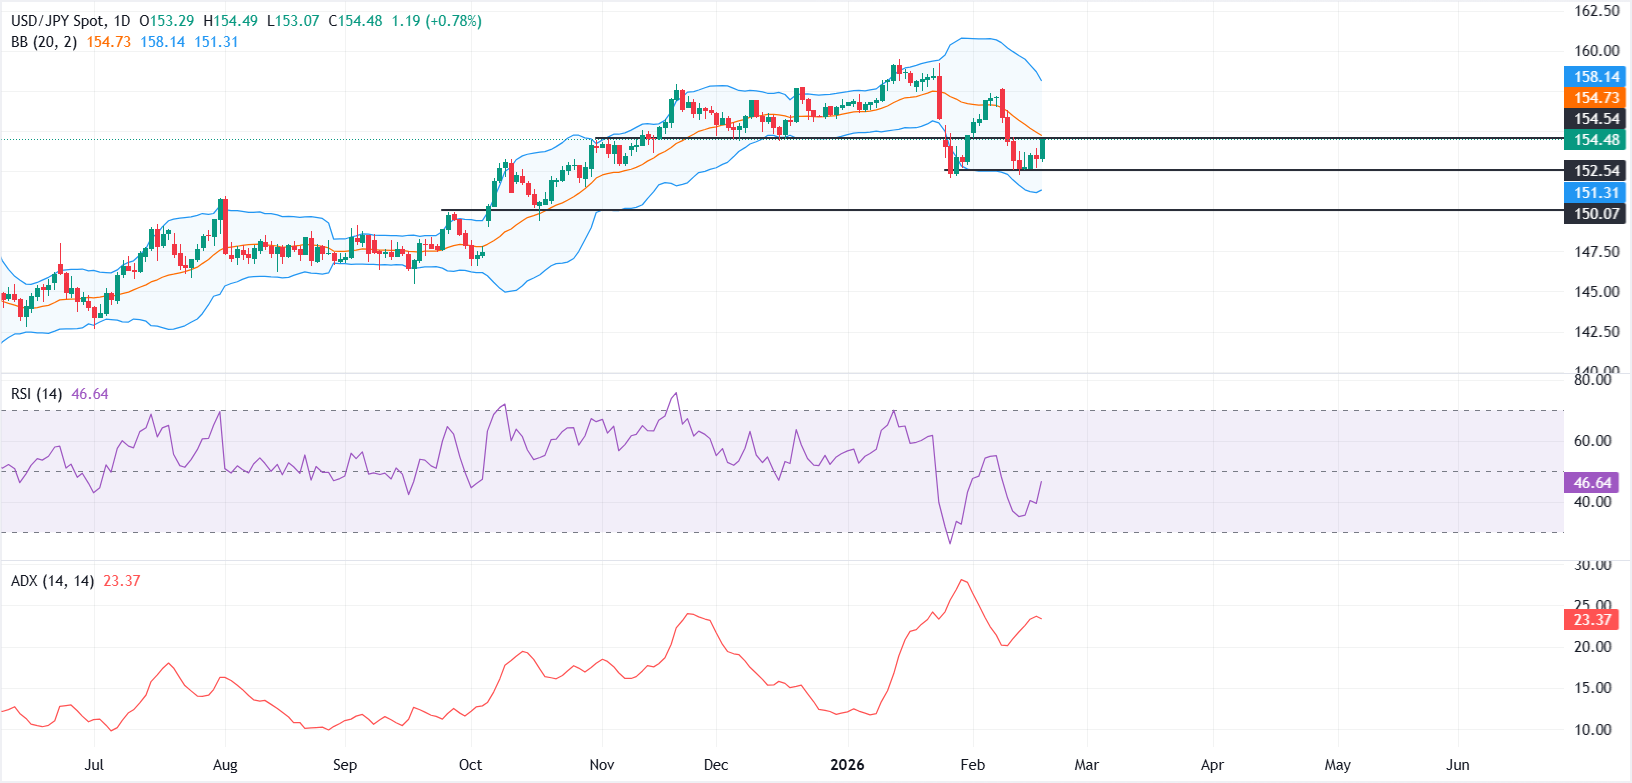
From a technical perspective, the daily chart suggests the near-term structure remains neutral to mildly bullish. Bollinger Bands have begun to narrow, reflecting fading volatility and a consolidative tone.
Price is hovering just below the middle band, which aligns with the 20-day Simple Moving Average (SMA) near 154.73, keeping upside attempts in check for now.
Initial resistance is seen in the 154.70-155.00 region. A sustained move above this zone could improve momentum and pave the way toward the upper Bollinger Band near 158.14.
On the downside, failure to reclaim the 20-day SMA would leave the pair vulnerable to the downside pressure, with the lower band around 151.31 acting as the next key support, followed by the 150.00 psychological mark.
The Relative Strength Index (RSI) stands near 46, remaining in neutral territory but edging higher from recent lows, which points to stabilising downside momentum.
Meanwhile, the Average Directional Index (ADX) around 23 signals only modest trend strength. This suggests the current move lacks strong conviction, and any meaningful breakout would likely require a clearer pickup in directional momentum to sustain follow-through.
Japanese Yen Price Today
The table below shows the percentage change of Japanese Yen (JPY) against listed major currencies today. Japanese Yen was the strongest against the New Zealand Dollar.
| USD | EUR | GBP | JPY | CAD | AUD | NZD | CHF | |
|---|---|---|---|---|---|---|---|---|
| USD | 0.35% | 0.20% | 0.80% | 0.27% | 0.23% | 1.03% | 0.28% | |
| EUR | -0.35% | -0.14% | 0.44% | -0.07% | -0.11% | 0.69% | -0.06% | |
| GBP | -0.20% | 0.14% | 0.59% | 0.07% | 0.03% | 0.83% | 0.07% | |
| JPY | -0.80% | -0.44% | -0.59% | -0.50% | -0.54% | 0.24% | -0.49% | |
| CAD | -0.27% | 0.07% | -0.07% | 0.50% | -0.04% | 0.75% | 0.01% | |
| AUD | -0.23% | 0.11% | -0.03% | 0.54% | 0.04% | 0.79% | 0.06% | |
| NZD | -1.03% | -0.69% | -0.83% | -0.24% | -0.75% | -0.79% | -0.74% | |
| CHF | -0.28% | 0.06% | -0.07% | 0.49% | -0.01% | -0.06% | 0.74% |
The heat map shows percentage changes of major currencies against each other. The base currency is picked from the left column, while the quote currency is picked from the top row. For example, if you pick the Japanese Yen from the left column and move along the horizontal line to the US Dollar, the percentage change displayed in the box will represent JPY (base)/USD (quote).
Author

Vishal Chaturvedi
FXStreet
I am a macro-focused research analyst with over four years of experience covering forex and commodities market. I enjoy breaking down complex economic trends and turning them into clear, actionable insights that help traders stay ahead of the curve.


