|

NZD/USD Price Analysis: Remains below two-week high amid modest USD strength

  • NZD/USD attracts some dip-buying on Tuesday, albeit lacks follow-through.
  • A positive risk tone lends some support; resurgent USD demand caps gains.
  • The technical setup supports prospects for a break through the 100-day SMA.

The NZD/USD pair reverses an intraday dip to levels just below the 0.6000 psychological mark and turns neutral during the first half of the European session. Spot prices currently trade around the 0.6020 area, unchanged for the day, and just below a nearly two-week high touched earlier this Tuesday.

A generally positive tone around the equity markets turns out to be a key factor lending some support to the risk-sensitive Kiwi. That said, the emergence of some US Dollar (USD) dip-buying, bolstered by bets for at least one more rate hike by the Federal Reserve (Fed), keeps a lid on any meaningful upside for the NZD/USD pair.

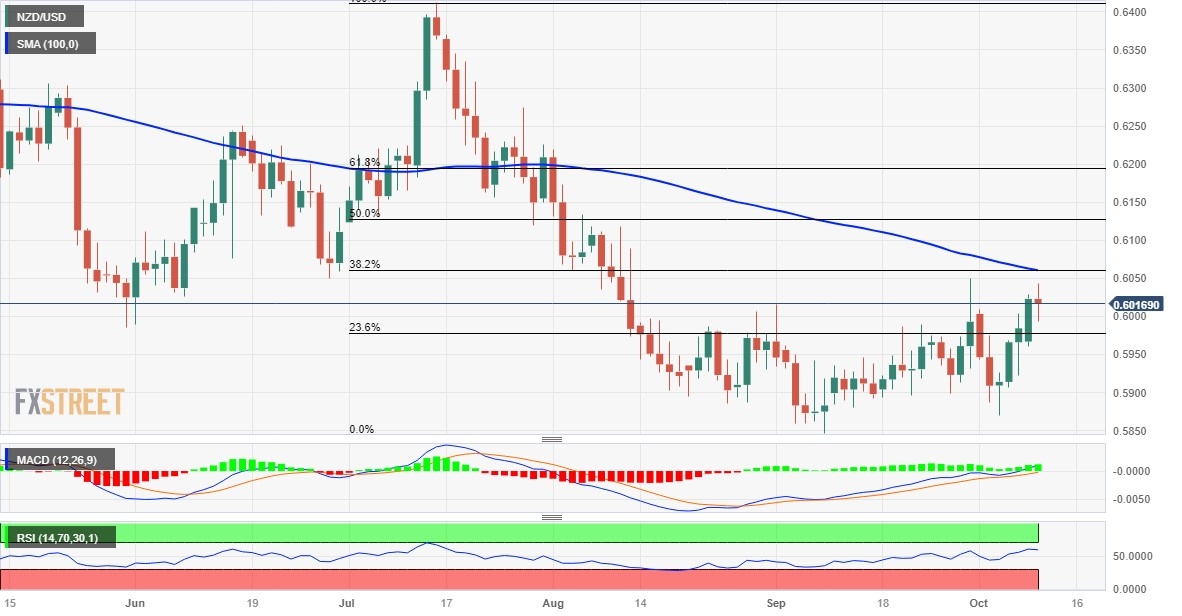
From a technical perspective, the 0.6050 area coincides with the September monthly swing high and is closely followed by the 100-day Simple Moving Average (SMA), around the 0.6060 region. The latter also represents the 38.2% Fibonacci retracement level of the July-August downfall and should now act as a key pivotal point.

A sustained strength beyond will be seen as a fresh trigger for bullish traders and pave the way for additional gains. With oscillators on the daily chart gaining positive traction, the NZD/USD pair might then aim towards reclaiming the 0.6100 mark and extend the momentum to the 0.6125-0.6130 region, or the 50% Fibo.

On the flip side, weakness below the 0.6000 mark is likely to find some support near the 23.6% Fibo. level, around the 0.5980-0.5975 region. A convincing break below could drag the NZD/USD pair back to the 0.5900 mark en route to last week's swing low, around the 0.5870 zone, which is followed by mid-0.5800s, or the YTD low.

NZD/USD daily chart

fxsoriginal

Technical levels to watch

NZD/USD

Overview
Today last price0.6021
Today Daily Change-0.0002
Today Daily Change %-0.03
Today daily open0.6023
 
Trends
Daily SMA200.5942
Daily SMA500.596
Daily SMA1000.6063
Daily SMA2000.6168
 
Levels
Previous Daily High0.6029
Previous Daily Low0.596
Previous Weekly High0.6009
Previous Weekly Low0.587
Previous Monthly High0.605
Previous Monthly Low0.5847
Daily Fibonacci 38.2%0.6003
Daily Fibonacci 61.8%0.5986
Daily Pivot Point S10.5979
Daily Pivot Point S20.5935
Daily Pivot Point S30.591
Daily Pivot Point R10.6048
Daily Pivot Point R20.6073
Daily Pivot Point R30.6117

Author

Haresh Menghani

Haresh Menghani is a detail-oriented professional with 10+ years of extensive experience in analysing the global financial markets.

More from Haresh Menghani
Share:

Editor's Picks

AUD/USD stays bid above 0.7100 on Australian trade data, Mideast optimism

AUD/USD clings to minor recovery gains above 0.7100 in the Asian session on Thursday as a new Israel-Lebanon ceasefire keeps a lid on the safe-haven US Dollar. Meanwhile, strong AustralianTrade Balane data also help the Aussie pair sustain the bounce from weekly lows.

USD/JPY hovers near the 160.00 intervention threshold on Mideast tensions

USD/JPY struggles to find acceptance above 160.00 and retreats from a one-month high in the Asian session on Thursday amid fears that authorities will step in again to prop up the Japanese Yen. Furthermore, a new Israel-Lebanon ceasefire caps the US Dollar and supports the currency pair. However, renewed US-Iran tensions keep the downside limited in the Greenback and the pair.

Gold rebounds from one-week low as Israel-Lebanon truce pressures safe-haven USD

Gold gains some positive traction on Thursday and climbs to the $4,475 area during the Asian session, reversing a major part of the previous day's slide to a one-week low. The Israel-Lebanon truce prompts some profit-taking around the US Dollar and supports the commodity. 


Ethereum: Long-term holders' capitulation drives ETH below $1,800

Ethereum has fallen below $1,800 on Wednesday, the first time since May 2025 following accelerated spot selling pressure and distributions from long-term holders. The Age Consumed metric, which tracks the movement of previously idle tokens or long-term holders' coins, spiked over the past two days as prices declined, indicating increased selling activity among this cohort.

Kevin Warsh takes the Fed helm: What it means for the US Dollar
The Federal Reserve moves away from the highly predictable "forward guidance" model of the Jerome Powell era to a new “Kevin Warsh environment”, characterized by less communication, more policy surprises, and an increased focus on the Fed's complex balance sheet.
Recession on paper: What really moves the Canadian Loonie now?

Statistics Canada handed the headline writers a gift and the analysts a headache. Real GDP shrank 0.1% on an annualized basis in the first quarter, and with the fourth quarter of 2025 revised down to a 1.0% contraction, that is two negative quarters in a row, the textbook definition of a technical recession and Canada's first since the pandemic.