|

NZD/USD Price Analysis: Pullback moves prod 0.6200 ahead of China Caixin PMI

  • NZD/USD takes offers to snap two-day uptrend, reverses from the highest levels in three weeks.
  • Weekly support line, one-month-old previous resistance line restrict immediate downside.
  • Failure to cross 50% Fibonacci retracement, looming bear cross on MACD favor Kiwi sellers.

NZD/USD takes offers to refresh intraday low near 0.6210 as it reverses the Fed-inspired gains during early Thursday amid a risk-off mood, as well as due to the anxiety ahead of China Caixin Manufacturing PMI for April.

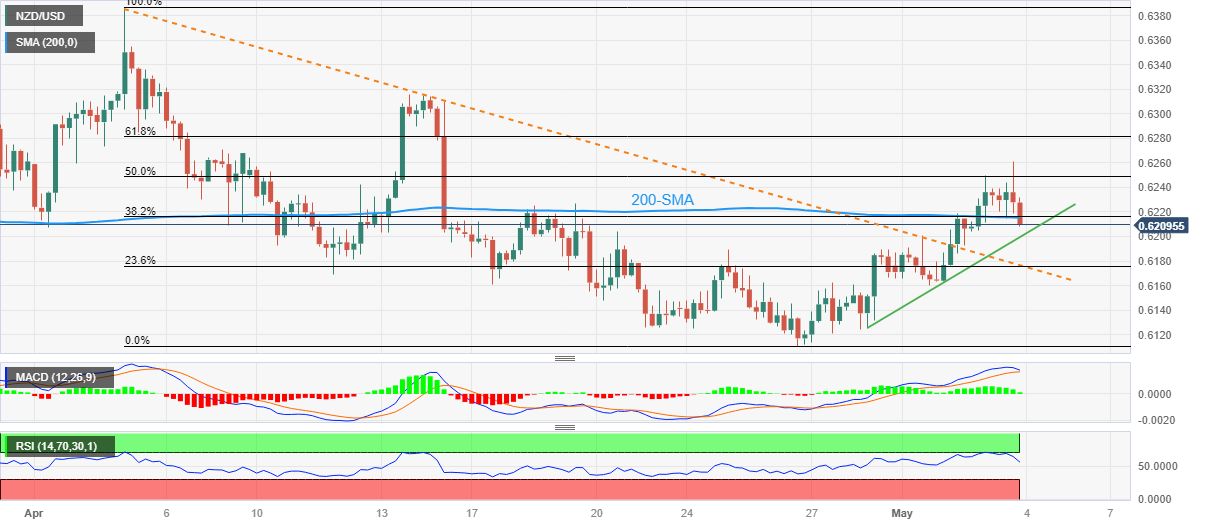
Technically, the Kiwi pair’s inability to cross the 50% Fibonacci retracement of its April 05-26 downside, near 0.6250, joins an impending bear cross on the MACD indicator to lure the sellers.

Adding strength to the bearish bias could be the recent downside break of the 200-SMA, around 0.6215 at the latest.

With this, the Kiwi pair is all set to drop toward the weekly support line of near 0.6200. However, the resistance-turned-support line from early April, near 0.6175 by the press time, could restrict the NZD/USD pair’s further downside.

Should the quote remains weak past 0.6175, the odds of witnessing a fall toward the previous monthly low, also the Year-To-Date (YTD) bottom, near 0.6110 can’t be ruled out.

On the contrary, recovery moves may initially aim for the 200-SMA level of around 0.6215 before challenging the 50% Fibonacci retracement and the recent swing high, respectively near 0.6250 and 0.6260.

Following that, the 61.8% Fibonacci retracement, also known as the golden ratio, of near 0.6280 will precede the 0.6300 round figure and mid-April swing high of 0.6316 to prod the NZD/USD bulls.

To sum up, NZD/USD slips to the bear’s radar but the downside room appears limited.

NZD/USD: Four-hour chart

Trend: Further downside expected

Additional important levels

Overview
Today last price0.6212
Today Daily Change0.0004
Today Daily Change %0.06%
Today daily open0.6208
 
Trends
Daily SMA200.6199
Daily SMA500.6207
Daily SMA1000.6283
Daily SMA2000.616
 
Levels
Previous Daily High0.6219
Previous Daily Low0.6163
Previous Weekly High0.6189
Previous Weekly Low0.6111
Previous Monthly High0.6389
Previous Monthly Low0.6111
Daily Fibonacci 38.2%0.6198
Daily Fibonacci 61.8%0.6184
Daily Pivot Point S10.6175
Daily Pivot Point S20.6141
Daily Pivot Point S30.6119
Daily Pivot Point R10.6231
Daily Pivot Point R20.6253
Daily Pivot Point R30.6287

Author

Anil Panchal

Anil Panchal

FXStreet

Anil Panchal has nearly 15 years of experience in tracking financial markets. With a keen interest in macroeconomics, Anil aptly tracks global news/updates and stays well-informed about the global financial moves and their implications.

More from Anil Panchal
Share:

Markets move fast. We move first.

Orange Juice Newsletter brings you expert driven insights - not headlines. Every day on your inbox.

By subscribing you agree to our Terms and conditions.

Editor's Picks

EUR/USD retreats toward 1.1700 on modest USD recovery

EUR/USD stays under mild bearish pressure and trades below 1.1750 on Friday. Although trading conditions remain thin following the New Year holiday and ahead of the weekend, the modest recovery seen in the US Dollar causes the pair to edge lower. The economic calendar will not feature any high-impact data releases.

GBP/USD struggles to gain traction, stabilizes near 1.3450

After testing 1.3400 on the last day of 2025, GBP/USD managed to stage a rebound. Nevertheless, the pair finds it difficult to gather momentum and trades marginally lower on the day at around 1.3450 as market participants remain in holiday mood.

Gold climbs toward $4,400 following deep correction

Gold advances toward $4,400 and gains more than 1.5% on the day after suffering heavy losses amid profit-taking heading into the end of the year. Growing expectations for a dovish Fed policy and persistent geopolitical risks seem to be helping XAU/USD stretch higher.

Cardano gains early New Year momentum, bulls target falling wedge breakout

Cardano kicks off the New Year on a positive note and is extending gains, trading above $0.36 at the time of writing on Friday. Improving on-chain and derivatives data point to growing bullish interest, while the technical outlook keeps an upside breakout in focus.

Economic outlook 2026-2027 in advanced countries: Solidity test

After a year marked by global economic resilience and ending on a note of optimism, 2026 looks promising and could be a year of solid economic performance. In our baseline scenario, we expect most of the supportive factors at work in 2025 to continue to play a role in 2026.

Crypto market outlook for 2026

Year 2025 was volatile, as crypto often is.  Among positive catalysts were favourable regulatory changes in the U.S., rise of Digital Asset Treasuries (DAT), adoption of AI and tokenization of Real-World-Assets (RWA).